. 2012 Aug;241(8):1274-88.
doi: 10.1002/dvdy.23817. Epub 2012 Jun 23.

Slits affect the timely migration of neural crest cells via Robo receptor

Affiliations

Slits affect the timely migration of neural crest cells via Robo receptor

Dion Giovannone et al. Dev Dyn. 2012 Aug.

Abstract

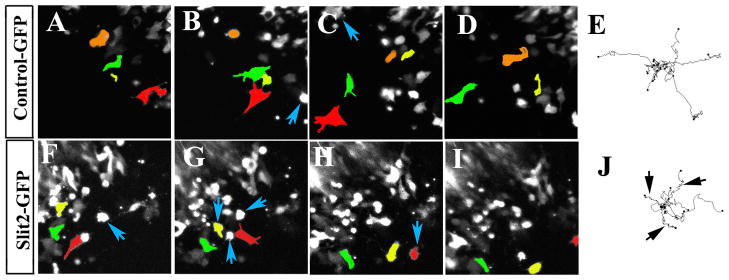
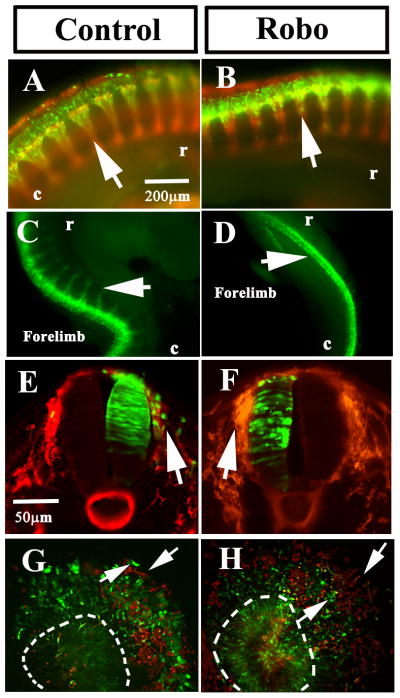
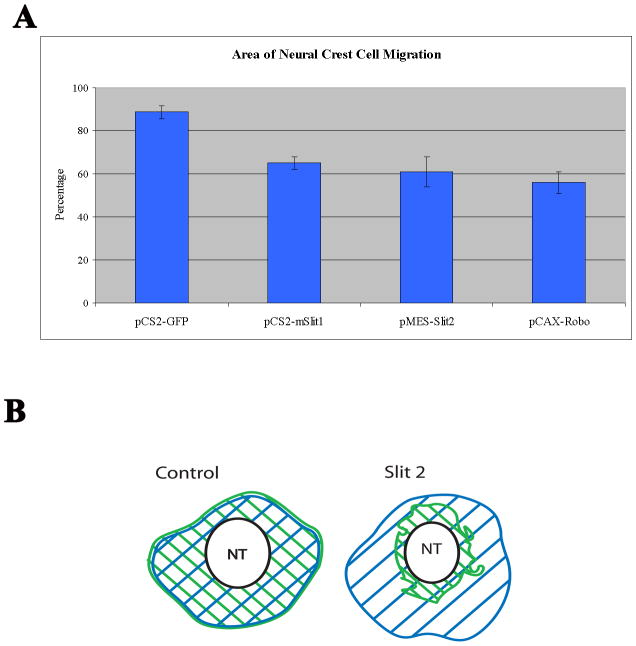
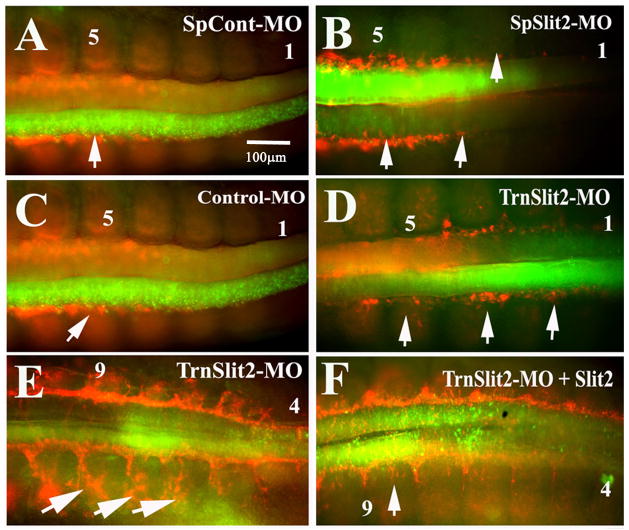
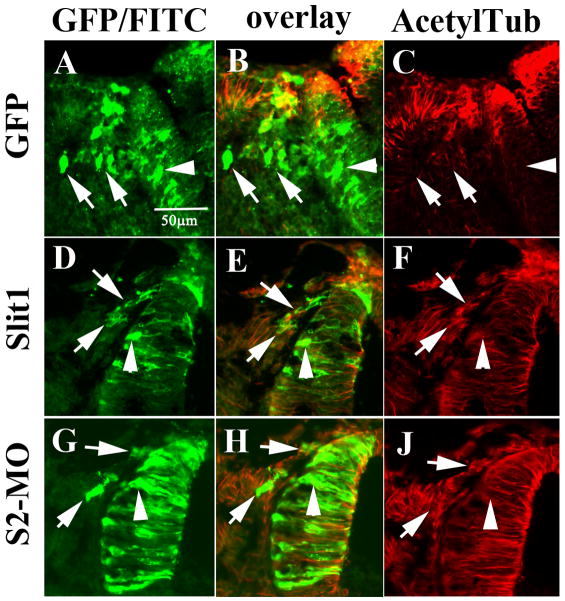
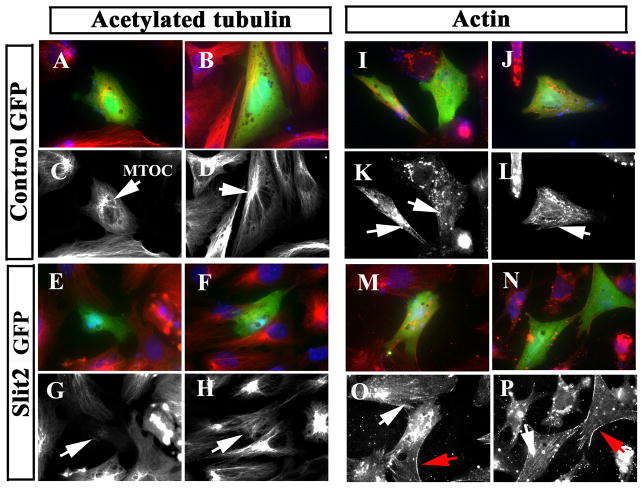
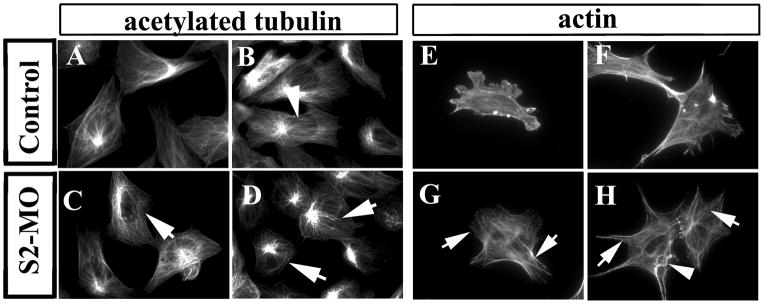
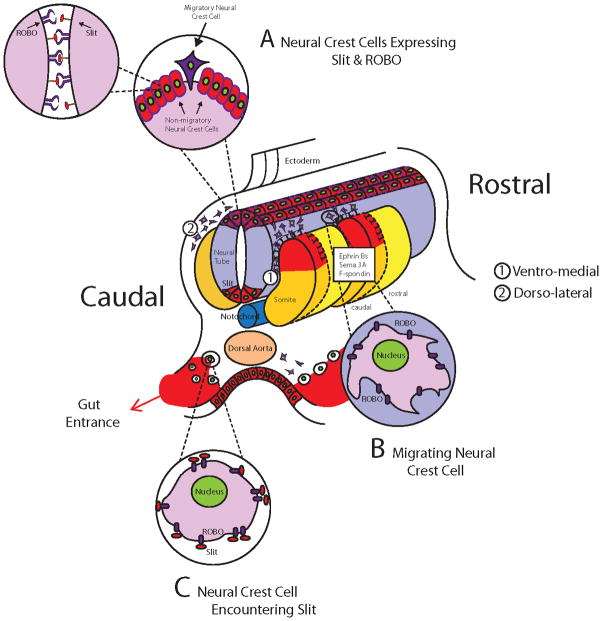
Background: Neural crest cells emerge by delamination from the dorsal neural tube and give rise to various components of the peripheral nervous system in vertebrate embryos. These cells change from non-motile into highly motile cells migrating to distant areas before further differentiation. Mechanisms controlling delamination and subsequent migration of neural crest cells are not fully understood. Slit2, a chemorepellant for axonal guidance that repels and stimulates motility of trunk neural crest cells away from the gut has recently been suggested to be a tumor suppressor molecule. The goal of this study was to further investigate the role of Slit2 in trunk neural crest cell migration by constitutive expression in neural crest cells.

Results: We found that Slit gain-of-function significantly impaired neural crest cell migration while Slit loss-of-function favored migration. In addition, we observed that the distribution of key cytoskeletal markers was disrupted in both gain and loss of function instances.

Conclusions: These findings suggest that Slit molecules might be involved in the processes that allow neural crest cells to begin migrating and transitioning to a mesenchymal type.


Figures

Figure 1
Figure 1. Slit molecules are expressed by pre-migratory neural crest cells
(A–E) Wholemount in situ hybridization images of chicken embryos with Slit1 (A), Slit2 (B), Slit3 (C), Robo1 (D) and Robo2 (E) anti-sense probes. HH12-13 chicken embryos showed expression of Slit ligands in dorsal neural tube (arrows in H–K sections for Slit1 and Slit2). Robo1 receptor is expressed in the medial somites (red arrow in D) but also in the neural tube at the most caudal portions (black arrowhead in D). While Robo2 receptor is expressed in the dorsal neural tube at the most rostral portion hindbrain and somites 1–10 (arrow in E, section in L of HH10-11). M shows Robo2 in situ section through the trunk of a HH16 embryo, highlighting that migrating trunk express Robo2 (arrowhead) while pre-migratory neural crest expresses practically no Robo2 (arrow). Sox10 in situ (F HH12-13, G HH10-11) highlight that at these stages only vagal neural crest has delaminated (N sections at vagal and O at trunk level). Bars indicate 50 or 200mm size.
Figure 2
Figure 2. Slit molecules over-expression impairs neural crest cell migration
Chicken embryos HH14-15 were electroporated with control GFP (A, C, E) or mSlit1 (B, F), hSlit2 (D) plasmids and incubated for 24 (A, B arrows point to forelimb area) or 48 (C–F arrows point to hindlimb area) hpe. Cells were visualized with anti-GFP or anti-myc for Slit1. Neural crest cells expressing Slit1 or Slit2 did not migrate as far as in control embryos (arrows in A–H), and Slit electroporated cells looked rounder and less dispersed than control GFP. Sections through a 48 hpe embryo at hindlimb level showed that a larger number of control electroporated cells reached the dorsal aorta (arrow in E) compared with mSlit1 expressing cells (arrow in F). Cultures of electroporated neural tubes (bright with DAPI) showed that mSlit1-expressing cells did not migrate as far as control GFP cells (arrows in G, H). Cross sections were counter-stained with HNK1 (red in E–F).
Figure 3
Figure 3. In vitro expression of Slit molecules impairs neural crest cell migration
Neural crest cells were cultured in vitro and chemically transfected with GFP. A Bar graph scoring cell shape of neural crest cells after electroporation (T-test: p<0.005, N=680 per each treatment). There were far fewer neural crest cells showing a migratory/mesenchymal morphology compared with GFP cells. B Morphology of neural crest cells chemically transfected with GFP, Slit2-GFP or MIF-GFP. C Graph showing individual cell area (y axis corresponds to μm2 of cell surface) for neural crest cells after transfection. Cells expressing Slit2-GFP were significantly smaller than control-GFP or MIF-GFP expressing cells (T-test: p<0.0004 T-test, N=60 cells per each treatment).
Figure 4
Figure 4. Aberrant migratory paths of neural crest cells shown by live imaging after Slit2 GOF
Sequential still images of movies were taken from Supplementary Movie 1 and 2. Three cells were pseudo-colored to highlight their path during the movie. Notice how the red-labeled cell in control movie moved across the field (A–C) and then disappeared (D). Neural crest cells expressing Slit stopped more frequently to round up than control cells (blue arrows B–C and F–H). Cell trackings from several movies were overlapped to characterize migratory behavior (E and J). While control electroporated cells moved farther away, Slit2 cells showed shorter and more tortuous paths (black arrows J) than control cells. Interestingly, while Slits cells showed impaired migration. Slit2: 53±63 um/hr (N=14) and GFP controls: 39±52.39 um/hr (N=16), p<0.45 unequal variance T-test.
Figure 5
Figure 5. Robo receptor over-expression impairs neural crest cell migration
Chicken embryos HH14-15 were electroporated with control-GFP or Robo1-GFP plasmids and incubated for 24 (A, B) or 48 (C–D) hpe. Neural crest cells expressing Robo1 did not migrate as far as in control embryos (arrows in A–H). Sections through a 24 hpe embryo at midtrunk level showed a larger number of control electroporated cells in the dorsal root ganglion area (arrow in E) compared with none in Robo1 section (arrow in F). Cultures of electroporated neural tubes showed that Robo1 cells could not migrate as far as control GFP cells (arrows in G, H). Embryos, cultures in A–B, E–H were counter-stained with HNK1 (red).
Figure 6
Figure 6. Quantification of in vitro Slit2 and Robo GOF effects on neural crest cell migration
A Neural tubes of chicken embryos HH14-15 were electroporated with control GFP, mSlit1 or hSlit2, or Robo1 plasmids, isolated and cultured overnight before fixing and measuring the total area covered by transfected cells normalized with total area covered by all cells as assessed by DAPI (B). Bar graph shows that neural tubes electroporated with mSlit1, hSlit2 and Robo1 had a ~30% reduction in total migration area compared with control GFP. N=20 neural tubes per treatment. Robo1 (56%), mSlit1 (65%) or hSlit2 (61%) control GFP-expressing (88%), T-test: p<0.005. Cartoon in B illustrates how we measured the total area (blue striped area) and transfected cells (green stripes) and how it looked for control GFP or Slit2 GOF experiments.
Figure 7
Figure 7. Slit2 loss of function enhances neural crest cell migration
Tail end of chicken embryos HH16 that were electroporated with splice Slit2 control (SpCont-MO) FITC, splice Slit2 (SpSlit2-MO), translational Slit2 (TrnSlit2-MO) or standard control morpholinos and incubated for 24 hpe (A–F). Neural crest cell migration in Slit2 morpholinos was present even in somite No.2 (see arrows pointing to earlier migration of HNK1 stained neural crest cells in B and D), way in advance compared with both types of control morpholinos (arrows pointing to normal migration in A and C). Rescue experiments by doing double electroporation of TrnSlit2-MO and Slit2 plasmid (F) showed that neural crest migration was now more similar to control levels compared with a TrnSlit2-MO alone (E that showed many migrating crest in somite 4). This behavior was more prominent when looking at migrating neural crest cells in the 9th somite (arrows).
Figure 8
Figure 8. Slit molecules affect the cytoskeleton in the neural crest
Sections through midtrunk region of chicken embryos HH13-15 electroporated with control-GFP (A–C), mSlit1-myc (D–F), or Slit2-MO (G–J, TrnS2-MO) were stained with anti-acetylated tubulin. Control GFP migrating neural crest cells did not express acetylated tubulin (B), while Slit1 did (E). Migrating S2-MO neural crest cells had lower staining of acetylated tubulin (H). interestingly, S2-MO neural tube cells also showed reduced level of acetylated tubulin (arrowhead in G–H) compared with Slit1 neural tube cells (arrowhead in D–F).
Figure 9
Figure 9. Slit molecules affect expression of cytoskeletal markers in the neural crest
Neural tubes were cultured and simultaneously transfected with Control or Slit2-GFP plasmids and stained for acetylated tubulin (A–H) and actin (I–P) shown in red channel or grayscale. Slit2 induced cytoskeletal re-arrangements in neural crest cells (E–H, M–P). While control-GFP showed normal microtubule organizing centers close to the nucleus (MTOC arrows in C, D), Slit2-expressing cells did not have such arrangement (arrows in G, H). Actin cytoskeleton in control-GFP cells showed stress fibers of migratory cells (arrows in K, L and O), while Slit2-expressing cells showed fewer stress fibers or none at all (arrows in O, P), in addition, they have more cortical actin than control cells (red arrows in O, P).
Figure 10
Figure 10. Slit2 morpholinos affect expression of cytoskeletal markers in the neural crest
Neural tubes were cultured after electroporation and stained with acetylated tubulin (A–D) or actin (E–H). Although most Slit2-MO neural crest cells have normal cytoplasmic distribution of microtubules and of their MTOC, the tubulin fibers were less diffuse (arrows in C, D) than in control cells (arrowhead in B). Actin cytoskeleton in S2-MO expressing cells showed more stress fiber (arrows in G, H) compared with controls. Less frequently we found abnormal actin fiber organization (arrowhead in H).
Figure 11
Figure 11. Graphical Abstract of Slit function during trunk neural crest migration
Cartoon showing the expression of Slits (red) and Robo receptors (blue) during trunk neural crest development. A Represents a pre-migratory neural crest cells that simultaneously expresses Slit and its Robo receptors, these cells are not motile. B Represents a migrating neural crest cells that expresses Robo receptors but no Slit, these are highly motile cells avoiding dermomyotome (Jia et al., 2005). C Represents neural crest cells expressing Robo receptors stopping by the dorsal aorta after encountering Slit molecules expressed at the entrance of the developing gut, these cells are non-motile, non-epithelial (De Bellard et al., 2003).

Similar articles

Cited by

References

    1. Berndt JD, Clay MR, Langenberg T, Halloran MC. Rho-kinase and myosin II affect dynamic neural crest cell behaviors during epithelial to mesenchymal transition in vivo. Dev Biol 2008 - PMC - PubMed
    1. Brose K, Bland KS, Wang KH, Arnott D, Henzel W, Goodman CS, Tessier-Lavigne M, Kidd T. Slit proteins bind Robo receptors and have an evolutionarily conserved role in repulsive axon guidance. Cell. 1999;96:795–806. - PubMed
    1. Brown A, Li Y, Slaughter T, Black MM. Composite microtubules of the axon - Quantitative-analysis of tyrosinated and acetylated tubuling along individual axonal microtubules. Journal of Cell Science. 1993;104:339–352. - PubMed
    1. Buchstaller J, Sommer L, Bodmer M, Hoffmann R, Suter U, Mantei N. Efficient isolation and gene expression profiling of small numbers of neural crest stem cells and developing Schwann cells. J Neurosci. 2004;24:2357–2365. - PMC - PubMed
    1. Chen L, Wang Z, Ghosh-Roy A, Hubert T, Yan D, O’Rourke S, Bowerman B, Wu Z, Jin Y, Chisholm AD. Axon regeneration pathways identified by systematic genetic screening in C. elegans. Neuron. 2011;71:1043–1057. - PMC - PubMed

Publication types

MeSH terms

Substances

LinkOut - more resources