. 2012 Aug 3;287(32):27255-64.
doi: 10.1074/jbc.M112.374629. Epub 2012 Jun 11.

Mitochondrial complex II can generate reactive oxygen species at high rates in both the forward and reverse reactions

Affiliations

Mitochondrial complex II can generate reactive oxygen species at high rates in both the forward and reverse reactions

Casey L Quinlan et al. J Biol Chem. .

Abstract

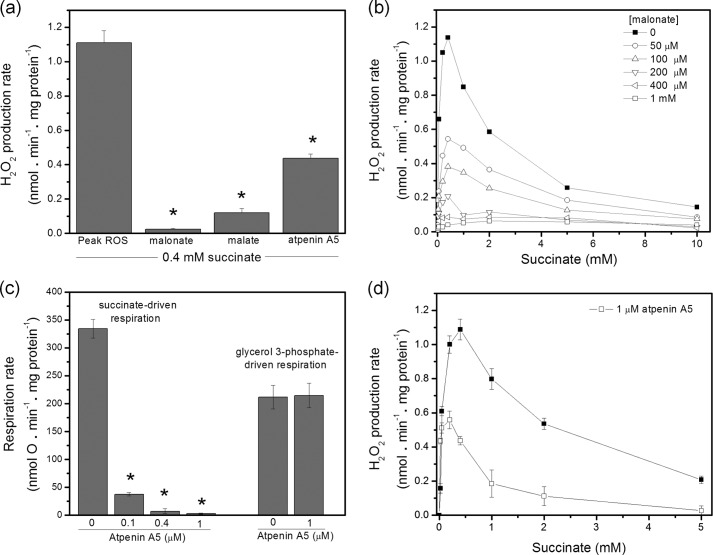
Respiratory complex II oxidizes succinate to fumarate as part of the Krebs cycle and reduces ubiquinone in the electron transport chain. Previous experimental evidence suggested that complex II is not a significant contributor to the production of reactive oxygen species (ROS) in isolated mitochondria or intact cells unless mutated. However, we find that when complex I and complex III are inhibited and succinate concentration is low, complex II in rat skeletal muscle mitochondria can generate superoxide or H(2)O(2) at high rates. These rates approach or exceed the maximum rates achieved by complex I or complex III. Complex II generates these ROS in both the forward reaction, with electrons supplied by succinate, and the reverse reaction, with electrons supplied from the reduced ubiquinone pool. ROS production in the reverse reaction is prevented by inhibition of complex II at either the ubiquinone-binding site (by atpenin A5) or the flavin (by malonate), whereas ROS production in the forward reaction is prevented by malonate but not by atpenin A5, showing that the ROS from complex II arises only from the flavin site (site II(F)). We propose a mechanism for ROS production by complex II that relies upon the occupancy of the substrate oxidation site and the reduction state of the enzyme. We suggest that complex II may be an important contributor to physiological and pathological ROS production.


Figures

FIGURE 1.
FIGURE 1.
Rates of H2O2 production from multiple sites during succinate oxidation. a, rat skeletal muscle mitochondria were incubated at 37 °C in standard assay medium containing 5 mm succinate in the absence of inhibitors, and H2O2 production was measured using Amplex UltraRed (first bar). A large proportion of this signal was eliminated by the subsequent addition of the complex I inhibitor rotenone (4 μm) (second bar), showing that it arose from complex I by reverse electron transport. Subsequent addition of myxothiazol (2 μm) eliminated signal emanating from site IIIQo (third bar). Data are means ± S.E. (n ≥ 3), *, significantly different from the rate with succinate alone (p < 0.05). b, candidate sites of superoxide and H2O2 production during succinate oxidation. Succinate is oxidized to fumarate by succinate dehydrogenase, reducing the flavin of complex II (site IIF). Electrons flow to the Q-binding site of complex II (site IIQ) and into the ubiquinone pool in the mitochondrial inner membrane (QH2/Q pool). From there they can reduce complex III at the outer Q-binding site (site IIIQo) or be driven by the protonmotive force by reverse electron transport into the Q-binding site of complex I (site IQ) and on to the flavin of complex I (site IF). In principle, they may also be able to reduce glycerol-3-phosphate dehydrogenase, ETF:Q oxidoreductase (ETF:QOR), or any other enzymes that respond to QH2/Q. In addition, fumarase may convert the fumarate produced by succinate oxidation into malate, which may be converted to oxaloacetate by malate dehydrogenase. This oxaloacetate may inhibit succinate dehydrogenase. The electrons from malate dehydrogenase reduce NAD+, which can reduce sites IF and IQ and the Q pool through complex I, and in principle may be able to reduce the dihydrolipoate moieties of α-ketoglutarate dehydrogenase and pyruvate dehydrogenase. The sites of inhibition by rotenone (IF), myxothiazol (IIIQo), malonate and oxaloacetate (IIF), and atpenin A5 (IIQ) are indicated. The orange-shaded area indicates the sites that may operate when succinate or glycerol 3-phosphate are added following inhibition by rotenone and myxothiazol, which inhibit centers in the blue-shaded areas. ETF: electron transferring flavoprotein; G3P, glycerol 3-phosphate; DHAP, dihydroxyacetone phosphate.
FIGURE 2.
FIGURE 2.
Dependence of H2O2 production rate in the presence of rotenone and myxothiazol on succinate concentration. Mitochondria were incubated with rotenone (4 μm) and myxothiazol (2 μm). Succinate was then added at concentrations ranging from 25 μm to 5 mm and steady-state rates of H2O2 production were measured. Data are means ± S.E. (n = 4).
FIGURE 3.
FIGURE 3.
Effect of inhibitors of complex II on H2O2 production in the presence of rotenone and myxothiazol and on respiration rate. a, rates of H2O2 production caused by addition of 400 μm succinate in the presence of 4 μm rotenone and 2 μm myxothiazol (first bar), and in the additional presence of 500 μm malonate (second bar), 1 mm malate (third bar), or 1 μm atpenin A5 (fourth bar) (n ≥ 4). Higher concentrations of each inhibitor did not have a greater inhibitory effect. b, effect of different concentrations of malonate on the titration shown in Fig. 2 (mean values shown, n = 3). c, effect of atpenin A5 on uncoupled respiration on α/β glycerol 3-phosphate (27 mm) and on succinate (5 mm). 1 μm FCCP and 4 μm rotenone were present in all experiments. d, effect of 1 μm atpenin A5 on the titration shown in Fig. 2 (n = 4). Higher concentrations of atpenin A5 did not have a greater inhibitory effect. Data are means ± S.E., except in b where only means are shown. *, significantly different from rate without inhibitor (p < 0.05). Closed symbols: uninhibited complex II, open symbols: malonate- or atpenin A5-inhibited complex II.
FIGURE 4.
FIGURE 4.
Correction for the effect of atpenin A5 on the activation state of complex II. a, effect of succinate concentration and atpenin A5 on the activation state of complex II. Intact mitochondria were incubated at 37 °C for 5 min in the presence of rotenone (4 μm), myxothiazol (2 μm), and a range of succinate concentrations as indicated, in the absence (closed symbols) or presence (open symbols) of 1 μm atpenin A5. Following incubation, the mitochondria were lysed at 15 °C and the rate of PMS-linked reduction of DCPIP induced by 10 mm succinate was measured to report the activation state achieved in the prior incubation (see “Experimental Procedures”). b, data of Fig. 3d replotted after normalization to the activation state of complex II derived from a. Normalized H2O2 production = nmol H2O2·min−1·mg mitochondrial protein−1 in the initial incubation/nmol DCPIP reduced min−1·mg mitochondrial protein−1 in the subsequent activity assay. Data are means ± S.E. (n = 3); standard errors were propagated to give the normalized standard error. A Student's t test indicated that there was no significant difference between the normalized maximum rates of H2O2 production.
FIGURE 5.
FIGURE 5.
Effects of malonate and atpenin A5 on rates of H2O2 production by mitochondria oxidizing glycerol 3-phosphate. a, α/β glycerol 3-phosphate was added at different concentrations in the presence of 4 μm rotenone, 2 μm myxothiazol, and 2 μm antimycin A. Where indicated, malonate was present at 500 μm or atpenin A5 was present at 1 μm. Data are means ± S.E. (n = 3) b, rate of H2O2 production during oxidation of 27 mm α/β glycerol 3-phosphate in the presence of 4 μm rotenone, in the absence and presence of 500 μm malonate or 1 μm atpenin A5. Neither malonate nor atpenin A5 change the rate of respiration or the reduction state of the NAD(P)H or cytochrome b pools indicating that these inhibitors do not affect substrate oxidation or the reduction state of other relevant ROS producing redox centers, as described in Ref. (data not shown). Data are means ± S.E. (n = 5–6) c, normalized rates of H2O2 production in the forward reaction at 400 μm succinate are shown in the first three bars (data from Fig. 4b). 500 μm malonate or 1 μm atpenin A5 were present where indicated. The final three bars are the normalized rates of H2O2 production in the reverse reaction. Data from a at 27 mm glycerol 3-phosphate (G3P) were normalized to the activity of the enzyme incubated under identical conditions (as described for Fig. 4). The rate in the presence of 500 μm malonate was made zero by definition. Data are means ± S.E. (n = 3). *, significantly different from rate without malonate or atpenin A5 (p < 0.02).
FIGURE 6.
FIGURE 6.
Maximum rates of superoxide/H2O2 production from different mitochondrial sites. Data were corrected for H2O2 consumption by matrix peroxidases using Equation 1. Data for the first three bars (sites IF, IQ, and IIIQo) are from footnote 4. In all cases measurements were made under conditions that we have found to maximize superoxide production rates from these sites. The final bar represents the CDNB-corrected rate of H2O2 production from site IIF (corrected data from Fig. 2). Data are means ± S.E. (n ≥ 3).
FIGURE 7.
FIGURE 7.
Model of superoxide and H2O2 production by complex II. Ovals and stars represent the states of the flavin in site IIF. The central five states represent the normal catalytic cycle (black arrows), with succinate entering the site and being converted to fumarate, with the reduced FADH2 then reoxidized in two steps by the FeS center and ultimately the Q pool. The fully reduced flavin (FADH2) or semi-reduced flavin (FADH·) are assumed to be the relevant ROS producers (star shapes), producing H2O2 or superoxide during two-electron or one-electron oxidation, respectively (gray arrows). Electrons can enter complex II from succinate oxidation (top) and exit to the Q-pool (bottom), or enter from the Q-pool and reduce the FAD (bottom). ROS production is only possible when the site is reduced but not occupied with substrate or substrate analog (i.e. succinate (suc), fumarate (fum), oxaloacetate (oxa), malonate (mal)). When substrate or substrate analogues are in the substrate binding site, the non-ROS-producing species “FAD-suc”, “FADH2-fum”, or generically “FAD-X” or “FADH2-X” are created. Presumably, the semireduced species (FADH·) can also bind substrate or substrate analogues, but that is not represented graphically.

References

    1. Bunik V. I., Sievers C. (2002) Inactivation of the 2-oxo acid dehydrogenase complexes upon generation of intrinsic radical species. Eur. J. Biochem. 269, 5004–5015 - PubMed
    1. Tretter L., Adam-Vizi V. (2004) Generation of reactive oxygen species in the reaction catalyzed by α-ketoglutarate dehydrogenase. J. Neurosci. 24, 7771–7778 - PMC - PubMed
    1. Grivennikova V. G., Kareyeva A. V., Vinogradov A. D. (2010) What are the sources of hydrogen peroxide production by heart mitochondria? Biochim. Biophys. Acta 1797, 939–944 - PMC - PubMed
    1. Adam-Vizi V. (2005) Production of reactive oxygen species in brain mitochondria: contribution by electron transport chain and non-electron transport chain sources. Antioxid. Redox. Signal. 7, 1140–1149 - PubMed
    1. Starkov A. A., Fiskum G. (2003) Regulation of brain mitochondrial H2O2 production by membrane potential and NAD(P)H redox state. J. Neurochem. 86, 1101–1107 - PubMed

Publication types

MeSH terms

LinkOut - more resources