. 2012 Jun 11;197(6):747-59.
doi: 10.1083/jcb.201112131.

Integrity of the P-site is probed during maturation of the 60S ribosomal subunit

Affiliations

Integrity of the P-site is probed during maturation of the 60S ribosomal subunit

Cyril Bussiere et al. J Cell Biol. .

Abstract

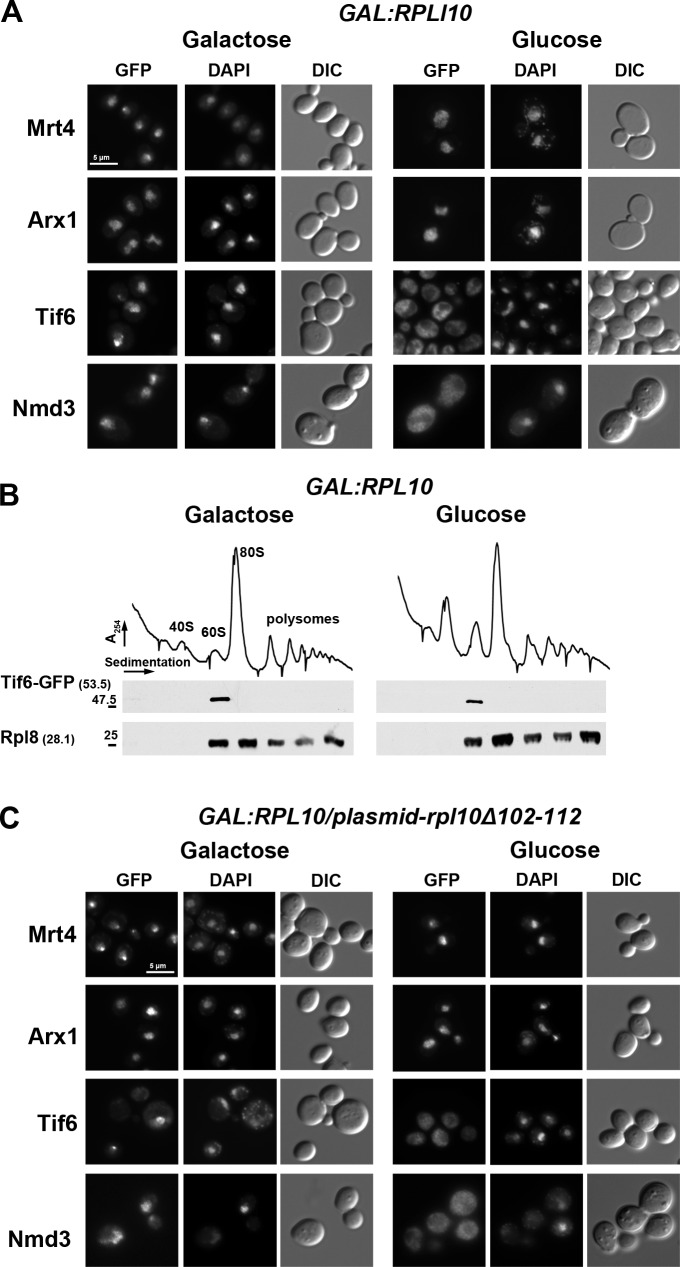
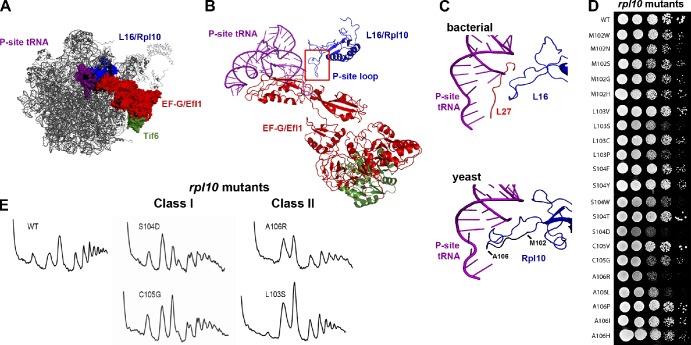
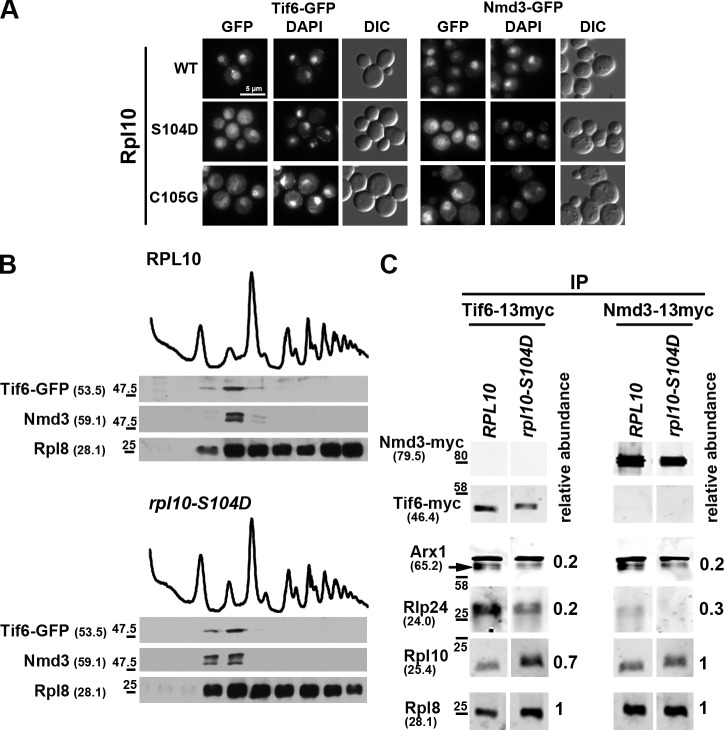
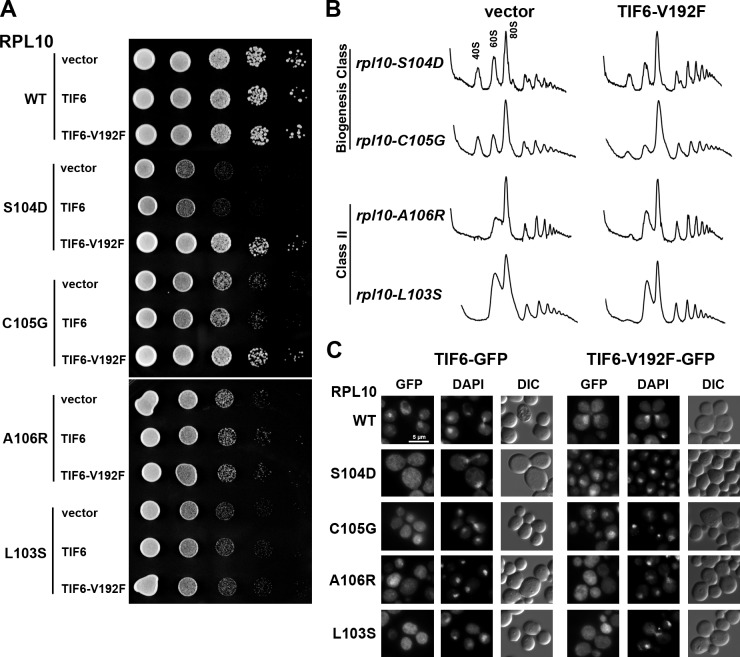
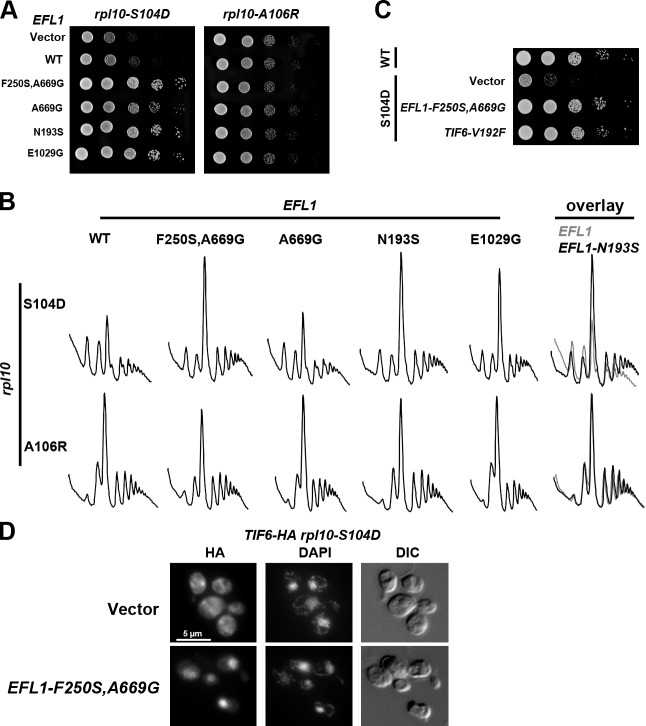
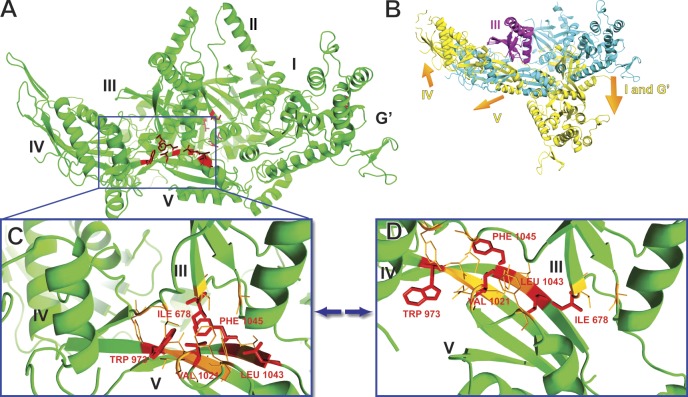
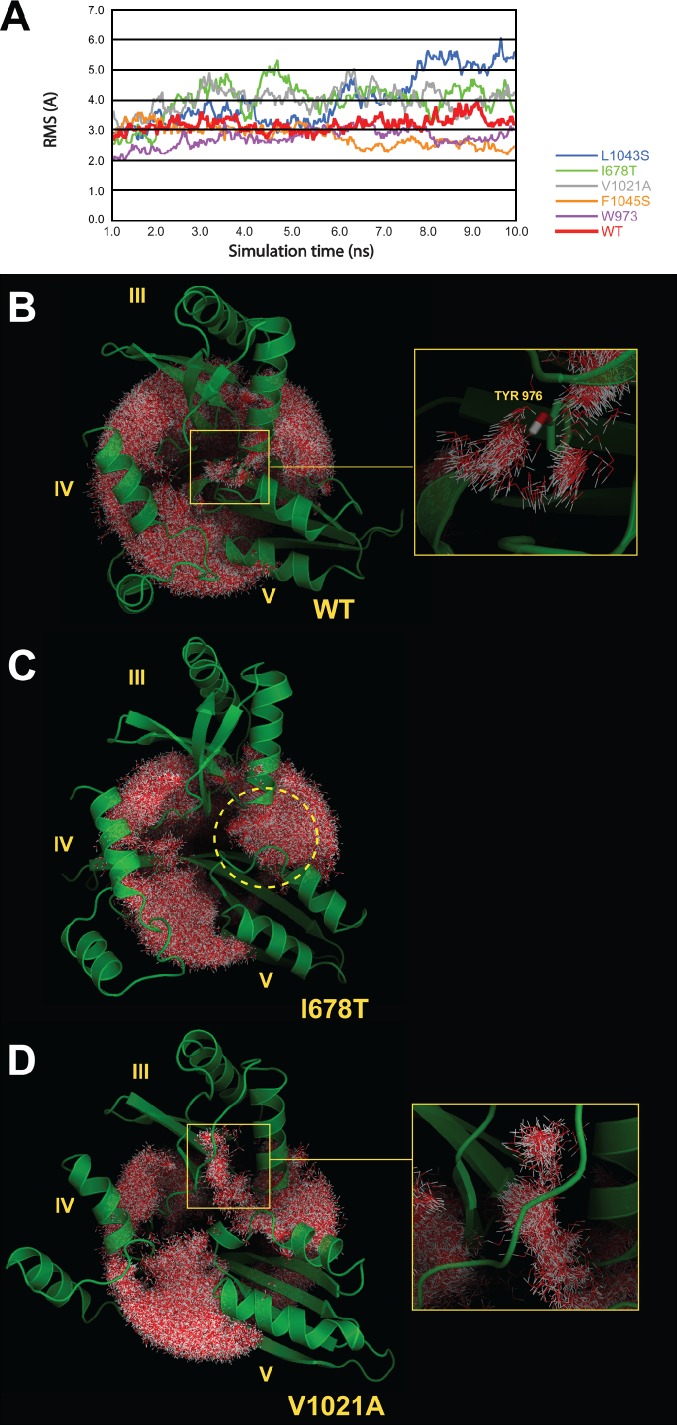
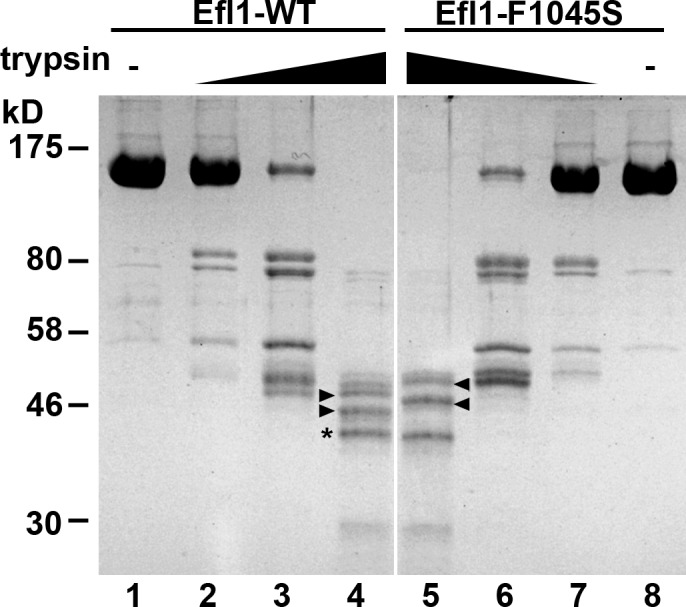
Eukaryotic ribosomes are preassembled in the nucleus and mature in the cytoplasm. Release of the antiassociation factor Tif6 by the translocase-like guanosine triphosphatase Efl1 is a critical late maturation step. In this paper, we show that a loop of Rpl10 that embraces the P-site transfer ribonucleic acid was required for release of Tif6, 90 Å away. Mutations in this P-site loop blocked 60S maturation but were suppressed by mutations in Tif6 or Efl1. Molecular dynamics simulations of the mutant Efl1 proteins suggest that they promote a conformation change in Efl1 equivalent to changes that elongation factor G and eEF2 undergo during translocation. These results identify molecular signaling from the P-site to Tif6 via Efl1, suggesting that the integrity of the P-site is interrogated during maturation. We propose that Efl1 promotes a functional check of the integrity of the 60S subunit before its first round of translation.


Figures

Figure 1.
Figure 1.
The P-site loop of Rpl10 is required for the release of Tif6 from 60S ribosomal subunits. (A) The localization of Mrt4, Arx1, Tif6, and Nmd3 was examined in the presence (galactose) or absence (glucose) of ongoing Rpl10 expression. AJY2766 (PGAL1-RPL10 TIF6-GFP), AJY2767 (PGAL1-RPL10 ARX1-GFP), and AJY2768 (PGAL1-RPL10 MRT4-GFP) were grown in galactose to mid-log phase; the cultures were split in two, and for one, Rpl10 expression was repressed for 2 h by the addition of glucose. GFP-tagged proteins were visualized by microscopy. AJY1837 (PGAL1-RPL10 NMD3-GFP crm1-T539C) was treated, as previously described, with the addition of LMB after glucose addition. DIC, differential interference contrast. (B) Sucrose gradient sedimentation of Tif6. AJY2766 (PGAL1-RPL10 TIF6-GFP) was cultured as described in A. Crude extracts were prepared and fractionated by sucrose gradient sedimentation. The position of Tif6 in gradients was monitored by Western blotting using anti-GFP antibody. Anti-Rpl8 was used to monitor the position of 60S subunits. Numbers in parentheses indicate the predicted molecular mass in kilodaltons of the protein being detected. Sizes (kD) and positions (−) of nearest molecular mass markers are indicated. (C) The Rpl10 P-site loop is required for release of Tif6 from 60S subunits. The GFP-tagged strains described in A were transformed with a vector (pAJ1777) expressing mutant RPL10 deleted of the P-site loop (rpl10-Δ102-112). GFP fluorescence of the tagged proteins was monitored under conditions of Rpl10 expression (galactose) or repression (glucose), as in A. Bars, 5 µm.
Figure 2.
Figure 2.
Mutagenesis of the P-site loop of Rpl10. (A) A composite image of the LSU showing the expected relative positions of L16/Rpl10, P-site tRNA, EF-G/Efl1, and Tif6 was made by docking yeast Tif6 (Protein Data Bank accession no. 2X7N; Gartmann et al., 2010) onto the bacterial 50S subunit with EF-G (PDB accession nos. 2WRI/2WRJ; Gao et al., 2009). The similarities between L16 and Rpl10 and EF-G and Efl1 suggest that we can use the bacterial proteins as proxies for the eukaryotic structures. (B) Ribbon diagram of the molecular linkage between the P-site loop of Rpl10 and Tif6, derived from A. (C) Comparison of the P-site tRNA interactions of L16 and Rpl10. (top) Bacterial L16, L27, and P-site tRNA (adapted from PDB accession nos. 2WRI/2WRJ; Gao et al., 2009). (bottom) Yeast Rpl10 (blue) and P-site tRNA (purple; PDB accession nos. 3IZC/3IZB/3IZE/3IZF; Armache et al., 2010). Residues of the P-site loop that were targeted for mutation (M102 through A106) are shown in black. Isolated mutations are listed. (D) Growth assay of the rpl10 P-site loop mutants. 10-fold serial dilutions of AJY1437 (rpl10Δ::KanMX) containing either WT (pAJ2522) or P-site loop mutants as the sole source of Rpl10 were spotted onto yeast extract peptone dextrose and grown for 2 d at 30°C. (E) The rpl10 P-site loop mutants can be separated in two classes based on polysome profiles. Extracts were prepared from AJY1437 containing WT (pAJ2522) or P-site loop mutants and sedimented through 7–47% sucrose gradients.
Figure 3.
Figure 3.
The Rpl10 P-site loop mutants trap Tif6 and Nmd3 on cytoplasmic 60S subunits. (A) Tif6-GFP and Nmd3-GFP localization were monitored in WT and rpl10 mutants. AJY2765 (TIF6-GFP rpl10Δ::KanMX) and AJY1837 (NMD3-GFP CRM1-T539C rpl10Δ::KanMX) containing WT (pAJ2522) or the indicated rpl10 P-site loop mutants were grown to mid-log phase, fixed with formaldehyde, DAPI stained, and visualized by microscopy. For Nmd3-GFP localization, cells were incubated with 0.4 µg/ml LMB for 5 min before fixing. DIC, differential interference contrast. Bar, 5 µm. (B) Sucrose gradient sedimentation of Tif6-GFP and Nmd3. AJY2765 (TIF6-GFP rpl10Δ::KanMX) containing WT (pAJ2522) or rpl10-S104D was cultured as described in Fig. 1 A. Cell extracts were prepared and fractionated by sucrose gradient sedimentation. The position of Tif6 and Nmd3 in gradients was monitored by Western blotting using anti-GFP and anti-Nmd3 antibodies, respectively. Anti-Rpl8 was used to monitor the position of 60S subunits. Protein molecular masses and size standards are given as described in the legend to Fig. 1 B. (C) Rpl10-S104D traps Nmd3 and Tif6 on the late-maturing 60S, resulting in a decrease in earlier factors present on Tif6 and Nmd3-bound subunits. Tif6 and Nmd3 were immunoprecipitated (IP) from the following extracts prepared from WT and mutant rpl10 strains: AJY1437 (rpl10Δ::KanMX) containing either WT RPL10 (pAJ2522) or rpl10-S104D and either Nmd3-13myc (pAJ1002) or Tif6-13myc (pAJ1009). The levels of coimmunoprecipitating Rpl8 (as a reporter for 60S), Rpl10, and trans-acting factors Arx1 and Rlp24 were determined by quantitative Western blotting using an infrared imaging system (Odyssey). The levels of Arx1, Rlp24, and Rpl10, relative to Rpl8, were normalized to that of the equivalent WT Rpl10 control. The arrow indicates Arx1; the upper band is nonspecific. Protein molecular masses and size standards are indicated as in B.
Figure 4.
Figure 4.
TIF6-V192F suppresses class I rpl10 P-site loop mutants. (A) The rpl10 deletion strain (AJY1437) containing WT (pAJ2522) or mutant RPL10 and either vector (pRS413), WT TIF6 (pAJ2543), or TIF6-V192F (pAJ2544) was grown in selective media, and 10-fold serial dilutions were spotted onto plates and incubated for 2 d at 30°C. (B) Extracts were prepared from the rpl10 deletion strain (AJY1437) containing rpl10 P-site loop mutants and either vector (pRS413) or TIF6-V192F (pAJ2544) and sedimented through 7–47% sucrose density gradients. A260 was monitored along the gradient. (C) The rpl10 deletion strain (AJY1437) containing WT (pAJ2522) or mutant RPL10 and vector harboring either WT TIF6-GFP (pAJ1004) or TIF6-V192F-GFP (pAJ2654) was grown in selective media. Cells were fixed with formaldehyde and stained with DAPI before visualization. DIC, differential interference contrast. Bar, 5 µm.
Figure 5.
Figure 5.
Mutations in EFL1 suppress rpl10-S104D. (A) AJY1437 (rpl10Δ::KanMX) with rpl10-S104D and either vector (pRS416), WT (pAJ2543), or suppressing alleles of TIF6 (pAJ2544) or WT (pAJ2545) or suppressing allele of EFL1 was grown in selective media. Serial dilutions were spotted on plates and grown for 2 d at 30°C. (B) AJY1437 (rpl10Δ::KanMX) with rpl10-S104D or rpl10-A106R with vector (pRS413), WT (pAJ2545), or mutant EFL1 was grown in selective media to mid-log phase, incubated with 50 µg/ml cycloheximide for 10 min, and harvested on ice. Crude extracts were fractionated by sedimentation through 7–47% sucrose gradients. A260 was monitored along the gradient. On the far right, for comparison, profiles for rpl10-S104D (top) or rpl10-A106R (bottom) with WT EFL1 or EFL1-N193S were overlayed. (C) AJY1437 (rpl10Δ::KanMX) with RPL10 WT or rpl10-S104D and vector (pRS413) or suppressing alleles of EFL1 or TIF6 (pAJ2544) was grown in selective media. 10-fold serial dilutions were spotted on plates and grown for 2 d at 30°C. (D) AJY2770 (PGAL1-RPL10 TIF6-3xHA) containing rpl10-S104D and either empty vector (pRS413) or a suppressing allele of EFL1 (EFL1-F250S,A669G) was grown to mid-log phase in galactose, and expression of genomic RPL10 was repressed by addition of glucose for 4 h, revealing the rpl10-S104D phenotype. Localization of TIF6-3xHA was monitored by indirect immunofluorescence using an anti-HA antibody (see Materials and methods). DIC, differential interference contrast. Bar, 5 µm.
Figure 6.
Figure 6.
Efl1 models in the apo and translocational conformations. (A) Efl1 model in the apo conformation. Residues in red highlight the positions of single-residue mutations that suppress rpl10-S104D. (B) A superimposition on domain III of Efl1 in two conformations, the apo (in cyan) and the translocational (in yellow) conformations. The orange arrows indicate the direction of movement of domains I, G’, IV, and V, relative to domain III, in the translocational conformation. The inserts unique to Efl1 are not displayed. (C) Zoom on the hydrophobic core of domains III and V of Efl1 in the apo conformation. (D) Zoom on the hydrophobic core of domains III and V of Efl1 in the translocational conformation. (C and D) Residues in red sticks are the inner residues of the hydrophobic core and designate the positions of the single-residue mutations. Residues in orange lines are additional hydrophobic residues surrounding the inner residues of the hydrophobic core.
Figure 7.
Figure 7.
MD simulations of the WT and mutant domain III:V interface. (A) RMSs of Efl1 hydrophobic core in the WT and mutant simulations. RMSs were calculated over domains III and V. Simulations were run for 10 ns. The time courses shown begin at 1 ns of simulation, after equilibration. (B, left) The hydration sphere surrounding the hydrophobic core during the simulation (for the WT simulation). (right) Zoom on the hydration tunnel passing around TYR976 residue in the hydrophobic core. (C) The hydration sphere surrounding the hydrophobic core during the simulation (for the I678T mutant simulation). The yellow dashed circle highlights the water molecules penetrating into the III:V domain interface in the hydrophobic core, leading to its partial opening. (D, left) The hydration sphere surrounding the hydrophobic core during the simulation (for the V1021A simulation). (right) Zoom on the region where water molecules penetrate the interface between the broken β sheet and the α helices in domain III. The hydration spheres were realized by superimposing a representative number of frames, extracted from the simulation trajectories (see Materials and methods for more details).
Figure 8.
Figure 8.
WT and mutant Efl1 show differential sensitivity to proteolysis. 0.5 µg of purified WT Efl1 or Efl1-F1045S was treated with increasing amounts of trypsin: no trypsin, lanes 1 and 8; 0.1 ng trypsin, lanes 2 and 7; 1 ng trypsin, lanes 3 and 6; 10 ng trypsin, lanes 4 and 5. Products were separated by SDS-PAGE and stained with Coomassie blue. Common fragments are indicated with an asterisk, and fragments that differ between WT and mutant are indicated by arrowheads. Positions of molecular mass markers are indicated to the left.

Similar articles

Cited by

References

    1. Agirrezabala X., Lei J., Brunelle J.L., Ortiz-Meoz R.F., Green R., Frank J. 2008. Visualization of the hybrid state of tRNA binding promoted by spontaneous ratcheting of the ribosome. Mol. Cell. 32:190–197 10.1016/j.molcel.2008.10.001 - DOI - PMC - PubMed
    1. Agrawal R.K., Penczek P., Grassucci R.A., Frank J. 1998. Visualization of elongation factor G on the Escherichia coli 70S ribosome: The mechanism of translocation. Proc. Natl. Acad. Sci. USA. 95:6134–6138 10.1073/pnas.95.11.6134 - DOI - PMC - PubMed
    1. Agrawal R.K., Heagle A.B., Penczek P., Grassucci R.A., Frank J. 1999. EF-G-dependent GTP hydrolysis induces translocation accompanied by large conformational changes in the 70S ribosome. Nat. Struct. Biol. 6:643–647 10.1038/10695 - DOI - PubMed
    1. Armache J.P., Jarasch A., Anger A.M., Villa E., Becker T., Bhushan S., Jossinet F., Habeck M., Dindar G., Franckenberg S., et al. 2010. Localization of eukaryote-specific ribosomal proteins in a 5.5-Å cryo-EM map of the 80S eukaryotic ribosome. Proc. Natl. Acad. Sci. USA. 107:19754–19759 10.1073/pnas.1010005107 - DOI - PMC - PubMed
    1. Arnold K., Bordoli L., Kopp J., Schwede T. 2006. The SWISS-MODEL workspace: A web-based environment for protein structure homology modelling. Bioinformatics. 22:195–201 10.1093/bioinformatics/bti770 - DOI - PubMed

Publication types

MeSH terms