

Change in tumor size by RECIST correlates linearly with overall survival in phase I oncology studies
- PMID: 22689801
- PMCID: PMC3413279
- DOI: 10.1200/JCO.2011.36.4752
Change in tumor size by RECIST correlates linearly with overall survival in phase I oncology studies
Abstract
Purpose: RECIST is used to quantify tumor changes during exposure to anticancer agents. Responses are categorized as complete response (CR), partial response (PR), stable disease (SD), or progressive disease (PD). Clinical trials dictate a patient's management options based on the category into which his or her response falls. However, the association between response and survival is not well studied in the early trial setting.
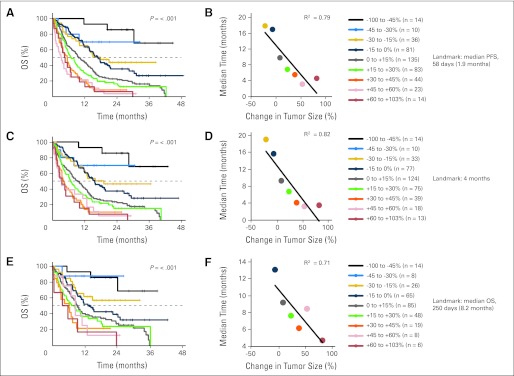
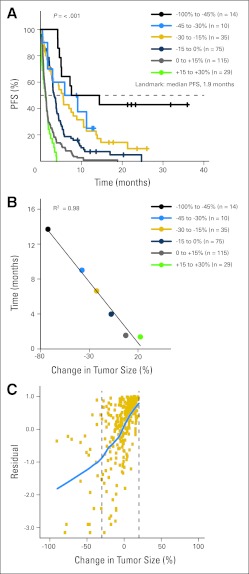
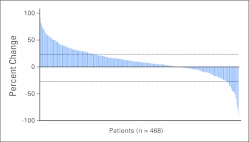
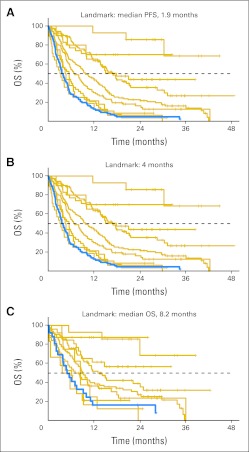
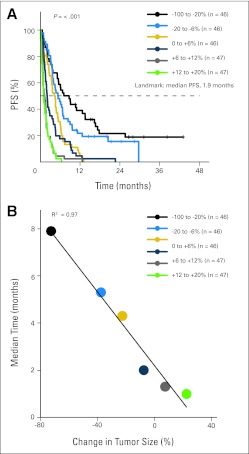
Patients and methods: To study the correlation between response as quantified by RECIST and overall survival (OS, the gold-standard survival outcome), we analyzed 570 participants of 24 phase I trials conducted between October 2004 and May 2009, of whom 468 had quantifiable changes in tumor size. Analyses of Kaplan-Meier estimates of OS by response and null Martingale residuals of Cox models were the primary outcome measures. All analyses are landmark analyses.
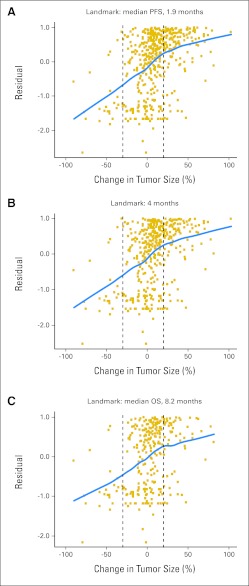
Results: Kaplan-Meier analyses revealed strong associations between change in tumor size by RECIST and survival (P = 4.5 × 10(-6) to < 1 × 10(-8)). The relationship was found to be near-linear (R(2) = 0.75 to 0.92) and confirmed by the residual analyses. No clear inflection points were found to exist in the relationship between tumor size changes and survival.
Conclusion: RECIST quantification of response correlates with survival, validating RECIST's use in phase I trials. However, the lack of apparent boundary values in the relationship between change in tumor size and OS demonstrates the arbitrary nature of the CR/PR/SD/PD categories and questions emphasis placed on this categorization scheme. Describing tumor responses as a continuous variable may be more informative than reporting categoric responses when evaluating novel anticancer therapies.
Conflict of interest statement
Authors' disclosures of potential conflicts of interest and author contributions are found at the end of this article.
Figures

Comment in
-
Tumor assessment criteria in phase I trials: beyond RECIST.J Clin Oncol. 2013 Jan 20;31(3):395. doi: 10.1200/JCO.2012.46.2184. Epub 2012 Dec 17. J Clin Oncol. 2013. PMID: 23248247 No abstract available.
-
Reply to A. Levy et al.J Clin Oncol. 2013 Jan 20;31(3):396. doi: 10.1200/JCO.2012.46.4867. J Clin Oncol. 2013. PMID: 23451354 No abstract available.
References
-
- Therasse P, Arbuck SG, Eisenhauer EA, et al. New guidelines to evaluate the response to treatment in solid tumors: European Organisation for Research and Treatment of Cancer, National Cancer Institute of the United States, National Cancer Institute of Canada. J Natl Cancer Inst. 2000;92:205–216. - PubMed
-
- Eisenhauer EA, Therasse P, Bogaerts J, et al. New response evaluation criteria in solid tumours: Revised RECIST guideline (version 1.1) Eur J Cancer. 2009;45:228–247. - PubMed
-
- Shanbhogue AK, Karnad AB, Prasad SR. Tumor response evaluation in oncology: Current update. J Comput Assist Tomogr. 2010;34:479–484. - PubMed
-
- Horstmann E, McCabe MS, Grochow L, et al. Risks and benefits of phase 1 oncology trials, 1991 through 2002. N Engl J Med. 2005;352:895–904. - PubMed
-
- Markman M. The needs of science vs the needs of patients: Ethical concerns in cancer clinical trials. Cleve Clin J Med. 2003;70:1008–1009. additional discussion: 1013-1014; 1016. - PubMed
Publication types
MeSH terms
Substances
Grants and funding
LinkOut - more resources
Full Text Sources
Research Materials
