. 2012 Jun 26;109(26):E1679-87.
doi: 10.1073/pnas.1119511109. Epub 2012 Jun 11.

Compressive fluorescence microscopy for biological and hyperspectral imaging

Affiliations

Compressive fluorescence microscopy for biological and hyperspectral imaging

Vincent Studer et al. Proc Natl Acad Sci U S A. .

Abstract

The mathematical theory of compressed sensing (CS) asserts that one can acquire signals from measurements whose rate is much lower than the total bandwidth. Whereas the CS theory is now well developed, challenges concerning hardware implementations of CS-based acquisition devices--especially in optics--have only started being addressed. This paper presents an implementation of compressive sensing in fluorescence microscopy and its applications to biomedical imaging. Our CS microscope combines a dynamic structured wide-field illumination and a fast and sensitive single-point fluorescence detection to enable reconstructions of images of fluorescent beads, cells, and tissues with undersampling ratios (between the number of pixels and number of measurements) up to 32. We further demonstrate a hyperspectral mode and record images with 128 spectral channels and undersampling ratios up to 64, illustrating the potential benefits of CS acquisition for higher-dimensional signals, which typically exhibits extreme redundancy. Altogether, our results emphasize the interest of CS schemes for acquisition at a significantly reduced rate and point to some remaining challenges for CS fluorescence microscopy.


Conflict of interest statement

The authors declare no conflict of interest.

Figures
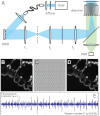
Fig. 1.
Fig. 1.
(A) Experimental setup. The dotted and plain segments correspond to planes respectively conjugated to the pupil and sample planes. (B) Slice of lily anther (endogenous fluorescence with epifluorescence microscopy image recorded on a CCD camera). (C) Projection of a Hadamard pattern on a uniform fluorescent sample. (D) Projection of the same Hadamard pattern on the biological sample. (E) Fluorescence intensity during an acquisition sequence.
Fig. 2.
Fig. 2.
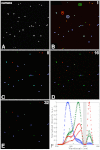
Top left to bottom right: camera snapshot and reconstructed 256-by-256 bead images for values of the undersampling ratio equal to 8, 16, 32, 64, and 128. (A) Plot of the PSNR (see text) for a nominal illumination level (blue curve) and for the same level reduced by a factor 10 (red curve) and a factor of 100 (green curve) (simulated data). The solid lines correspond to the PSNR in raster scan for the same surfacic illumination. (B) Same as (A) for the experimental data.
Fig. 3.
Fig. 3.
Upper line: CS imaging of a slice of a lily anther. Left: Original image (128 × 128 pixels) by conventional epifluorescence microscopy. Left to right: the same sample imaged by CFM with undersampling ratios between 1 and 8. Lower line: CS imaging of COS7 cells expressing Zyxin-mEOS2. Left: superposition of the conventional epifluorescence images of the native (green) and converted form (red) of the markers. Left to right: CFM images of the converted form of the markers at undersampling ratios equal to 2, 4, 8, and 15.
Fig. 4.
Fig. 4.
(AE) Camera snapshot and reconstructed 256-by-256 bead images for undersampling ratios equal to 1, 8, 16, and 32. (F) Normalized spectra (128 spectral lines) of three individual different beads circled in (B) for undersampling ratios equal to 1 (plain circles), 32 (squares), and 64 (triangles). The gray area in the spectrum represents a rejection band of the dichroic mirror used in our setup.
Fig. P1.
Fig. P1.
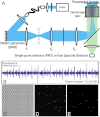
Experimental setup of the compressive fluorescence microscope. The microscope provides a computer-controlled patterned laser illumination based on a digital micromirror device (DMD). For each pattern in the DMD, the fluorescence from the sample is recorded on a single point detector (B) or on a spectral detector. One typical pattern is shown in (C). The conventional fluorescence camera image of a sparse distribution of 2-μm-diameter multicolor fluorescent beads is shown in (D). A multicolor image of the same sample obtained with our compressive fluorescence microscope is shown in (D). A compression ratio of 16 is achieved for this image.

References

    1. Mertz J. Introduction to Optical Microscopy. Greenwood Village, CO: Roberts and Company Publishers; 2010.
    1. Brady DJ. Optical Imaging and Spectroscopy. Hoboken, NJ: Wiley; 2010.
    1. Donoho DL. Compressed sensing. IEEE T Inform Theory. 2006;52:1289–1306.
    1. Candes E, Romberg J, Tao T. Robust uncertainty principles: exact signal reconstruction from highly incomplete frequency information. IEEE T Inform Theory. 2006;52:489–509.
    1. Lustig M, Donoho D, Pauly P. Sparse MRI: the application of compressed sensing for rapid MR imaging. Magn Reson Med. 2007;58:1182–1195. - PubMed

Publication types

LinkOut - more resources