. 2012 Jun 26;109(26):10438-43.
doi: 10.1073/pnas.1120688109. Epub 2012 Jun 12.

Analysis of neural subtypes reveals selective mitochondrial dysfunction in dopaminergic neurons from parkin mutants

Affiliations

Analysis of neural subtypes reveals selective mitochondrial dysfunction in dopaminergic neurons from parkin mutants

Jonathon L Burman et al. Proc Natl Acad Sci U S A. .

Abstract

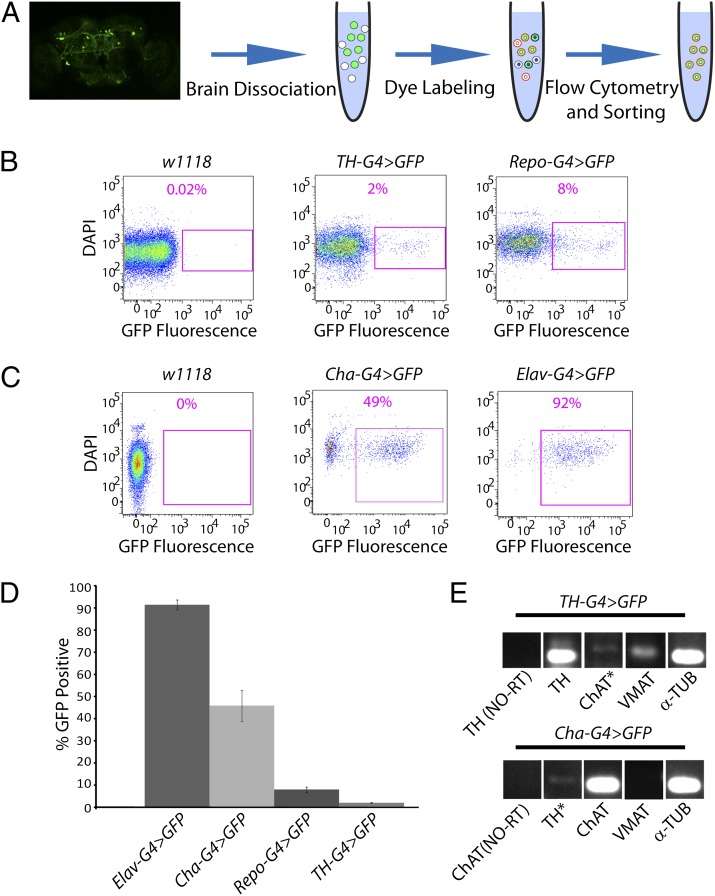
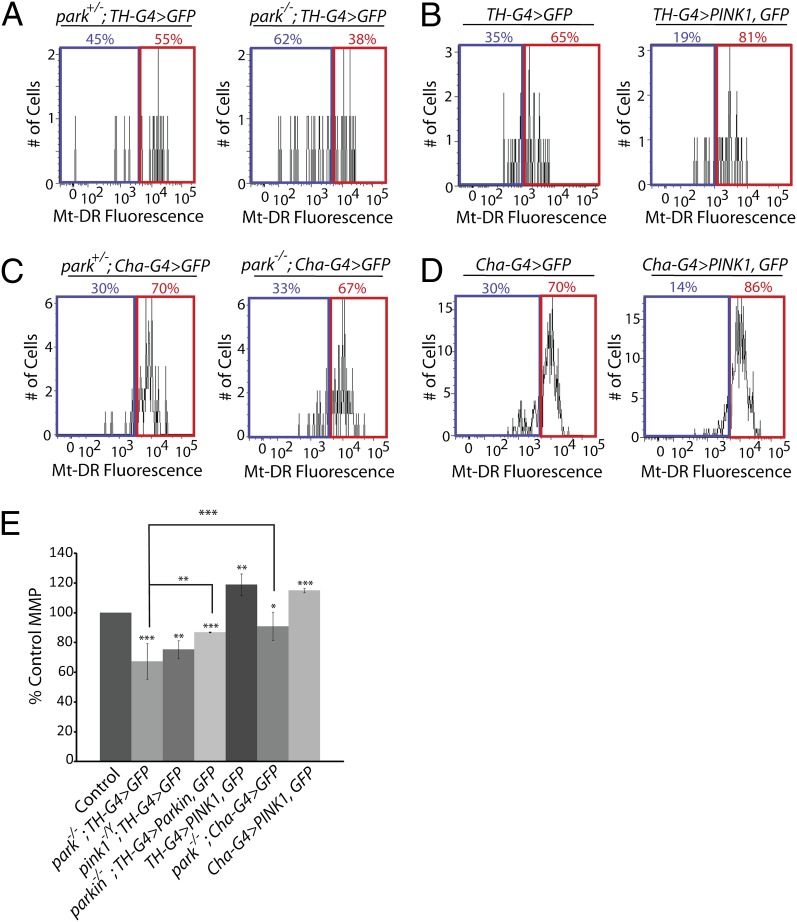
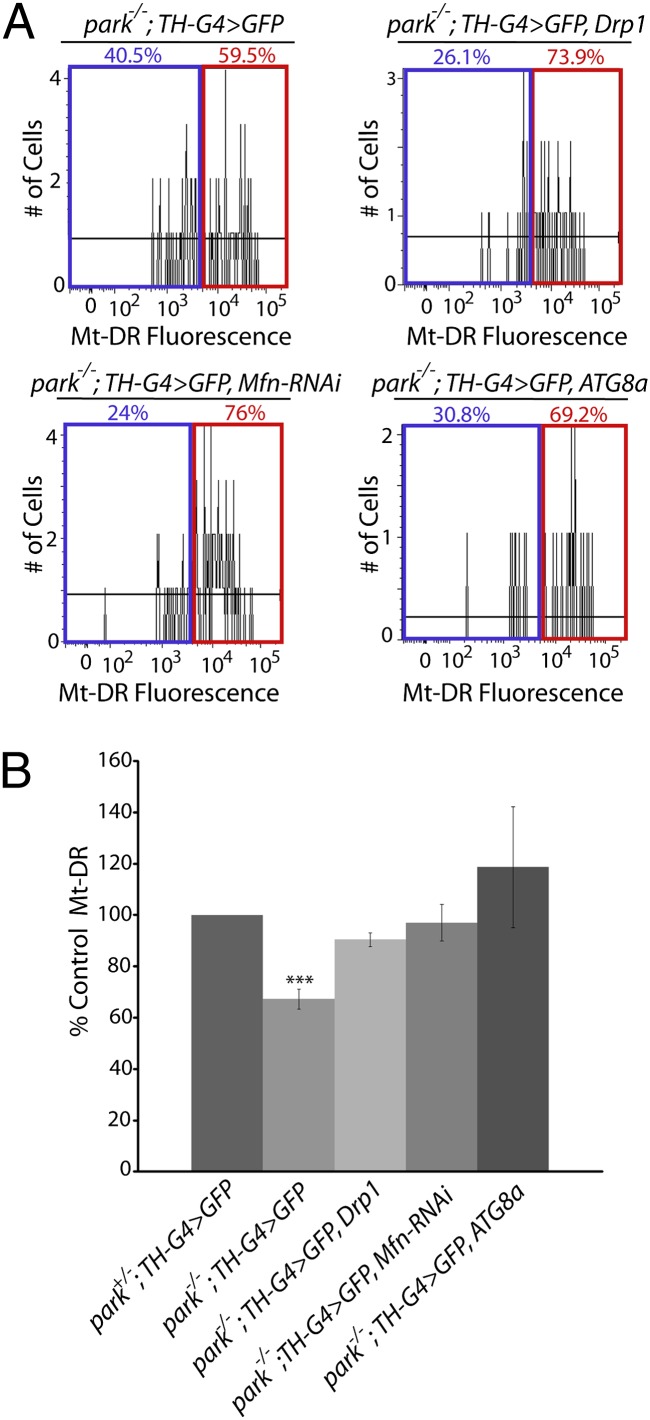
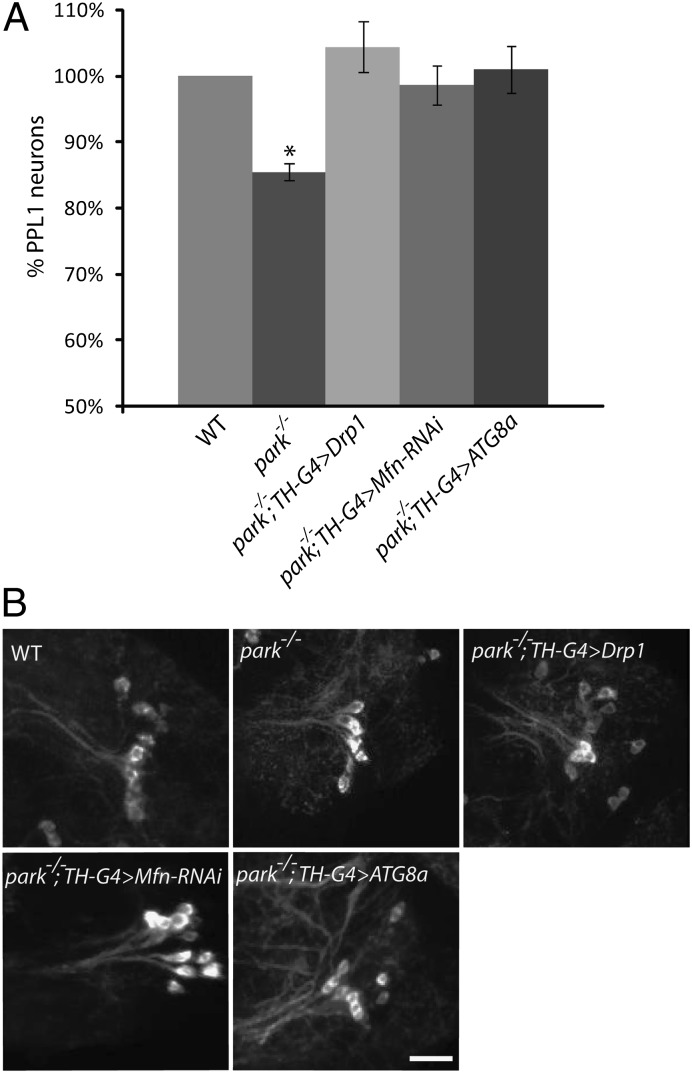
Studies of the familial Parkinson disease-related proteins PINK1 and Parkin have demonstrated that these factors promote the fragmentation and turnover of mitochondria following treatment of cultured cells with mitochondrial depolarizing agents. Whether PINK1 or Parkin influence mitochondrial quality control under normal physiological conditions in dopaminergic neurons, a principal cell type that degenerates in Parkinson disease, remains unclear. To address this matter, we developed a method to purify and characterize neural subtypes of interest from the adult Drosophila brain. Using this method, we find that dopaminergic neurons from Drosophila parkin mutants accumulate enlarged, depolarized mitochondria, and that genetic perturbations that promote mitochondrial fragmentation and turnover rescue the mitochondrial depolarization and neurodegenerative phenotypes of parkin mutants. In contrast, cholinergic neurons from parkin mutants accumulate enlarged depolarized mitochondria to a lesser extent than dopaminergic neurons, suggesting that a higher rate of mitochondrial damage, or a deficiency in alternative mechanisms to repair or eliminate damaged mitochondria explains the selective vulnerability of dopaminergic neurons in Parkinson disease. Our study validates key tenets of the model that PINK1 and Parkin promote the fragmentation and turnover of depolarized mitochondria in dopaminergic neurons. Moreover, our neural purification method provides a foundation to further explore the pathogenesis of Parkinson disease, and to address other neurobiological questions requiring the analysis of defined neural cell types.


Conflict of interest statement

The authors declare no conflict of interest.

Figures

Fig. 1.
Fig. 1.
A method for purification and analysis of neural subsets from the adult Drosophila brain. (A) Adult fly brains expressing GFP (green) in a cell type of interest are dissociated and labeled with the cell viability dye DAPI, as well as a MMP-dependent dye. The resulting cell suspension contains dead cells staining brightly for DAPI (white and green cells with blue nuclei), but lacking MMP-dependent staining, and living cells staining less brightly for DAPI (white and green cells with white nuclei) that exhibit MMP-dependent staining (red outlines). (Magnification: 20×.) (B) Neural preparations from nontransgenic flies (w1118) and from flies expressing GFP in DA neurons (TH-G4 > GFP) or glia (Repo-G4 > GFP) were analyzed by flow cytometry. Representative dot plots depict the DAPI/GFP+ cell populations (purple boxed regions) and their frequency of abundance. (C) Neural preparations from nontransgenic flies (w1118) and from flies expressing GFP in CH neurons (Cha-G4 > GFP) or pan-neuronally (Elav-G4 > GFP) were analyzed by flow cytometry. Representative dot plots are as described in B. (D) The mean abundance of the indicated cell types is depicted. The number of biological replicates (n) and total number of cells analyzed (N) were as follows: Elav-G4 > GFP (n = 4; N = 12,563); CH-G4 > GFP (n = 5; N = 2,432); Repo-G4 > GFP (n = 4; N = 2,286); TH-G4 > GFP (n = 5; N = 842). (E) DA and CH neurons isolated by FACS were subjected to RT-PCR to detect transcripts corresponding to tyrosine hydroxylase (TH), choline acetyltransferase (ChAT), vesicular monoamine transporter (VMAT), and α-tubulin (α-TUB). RT-PCR reactions lacking reverse transcriptase (NO-RT) represent negative controls. Asterisks denote lanes with nonspecific bands of the incorrect size. The specific genotypes of the animals used in this and all other figures are fully defined in SI Materials and Methods.
Fig. 2.
Fig. 2.
The PINK1/Parkin pathway influences MMP in neurons. (A–D) Representative histograms show the percentage of neurons that exhibit Mt-DR fluorescence intensities above (red boxes) and below (blue boxes) the assigned cut-off intensity value determined by flow cytometry analysis of the following animals: (A) parkin-null heterozygote controls and sibling parkin-null homozygotes expressing GFP in DA neurons (park+/−; TH-G4 > GFP and park−/−; TH-G4 > GFP, respectively). (B) Control flies lacking PINK1 overexpression (TH-G4 > GFP) and siblings overexpressing PINK1 in DA neurons (TH-G4 > PINK1, GFP). (C) parkin-null heterozygote controls and sibling parkin-null homozygotes expressing GFP in CH neurons (park+/−; Cha-G4 > GFP and park−/−; Cha-G4 > GFP, respectively). (D) Control flies lacking PINK1 overexpression in CH neurons (Cha-G4 > GFP), and siblings overexpressing PINK1 (Cha-G4 > PINK1, GFP). (E) Mean MMP in DA or CH neurons from animals of the indicated genotypes relative to their respective sibling controls. The number of biological replicates (n) and total number of cells analyzed (N) were as follows: park−/−; TH-G4 > GFP (n = 4; N = 230); pink1−/Y; TH-G4 > GFP (n = 3; N = 353); park−/−; TH-G4>Parkin, GFP (n = 3; N = 156); park−/−; Cha-GAL4 > GFP (n = 4; N = 6,434); TH-G4 > PINK1, GFP (n = 4; N = 258); Cha-G4 > PINK1, GFP (n = 4; N = 4,857). Statistical tests used in this work are described in Materials and Methods. For all experiments and figures: *P < 0.05, **P < 0.01, ***P < 0.001.
Fig. 3.
Fig. 3.
Genetic perturbations that increase mitochondrial fragmentation and turnover rescue the MMP defect of parkin mutants. (A) Neural cultures from parkin-null homozygotes expressing GFP (park−/−; TH-G4 > GFP), from parkin-null homozygotes overexpressing GFP and Drp1 (park−/−; TH-G4 > GFP, Drp1), from parkin-null homozygotes overexpressing GFP and an RNAi construct targeting Mfn (park−/−; TH-G4 > GFP, Mfn-RNAi), or from parkin-null homozygotes overexpressing GFP and ATG8a (park−/−; TH-G4 > GFP, ATG8a) in DA neurons were labeled with Mt-DR and analyzed by flow cytometry. Representative histograms show the percentage of neurons that exhibit Mt-DR fluorescence intensities above and below the cutoff intensity value. (B) Depiction of the mean MMP of DA neurons from animals of the indicated genotypes relative to parkin-null heterozygotes (park+/−; TH-G4 > GFP). The number of biological replicates (n) and total number of cells analyzed (N) for the following genotypes were as follows: park−/−; TH-G4 > GFP (n = 3; N = 299); park−/−; TH-G4 > GFP, Drp1 (n = 3; N = 189); park−/−; TH-G4 > GFP, Mfn-RNAi (n = 3; N = 218); park−/−; TH-G4 > GFP, ATG8a (n = 5; N = 154). ***P < 0.001.
Fig. 4.
Fig. 4.
Genetic perturbations that increase mitochondrial fragmentation and turnover rescue the neurodegenerative phenotype of parkin mutants. (A) The relative percentage of DA neurons in the PPL1 cluster from wild-type flies, parkin-null homozygotes (park−/−), parkin-null homozygotes overexpressing Drp1 in DA neurons (park−/−; TH-G4 > Drp1), parkin-null homozygotes overexpressing an RNAi construct targeting Mfn in DA neurons (park−/−; TH-G4 > Mfn-RNAi), or from parkin-null homozygotes overexpressing ATG8a in DA neurons (park−/−; TH-G4 > ATG8a) are shown. The number of biological replicates (n) and total number of cells analyzed (N) were as follows: WT (n = 3; N = 88); park−/− (n = 6; N = 122); park−/−; TH-G4 > Drp1 (n = 3; N = 69); park−/−; TH-G4 > Mfn-RNAi (n = 2; N = 34); park−/−; TH-G4 > ATG8a (n = 3; N = 40). Error bars represent SE. *P < 0.05 (B) Representative confocal images of PPL1 DA neurons from the genotypes described in A are shown in brains stained with an antiserum against tyrosine hydroxylase. (Scale bar, 10 μm.)

References

    1. Farrer MJ. Genetics of Parkinson disease: Paradigm shifts and future prospects. Nat Rev Genet. 2006;7:306–318. - PubMed
    1. Shulman JM, De Jager PL, Feany MB. Parkinson’s disease: Genetics and pathogenesis. Annu Rev Pathol. 2011;6:193–222. - PubMed
    1. Zhu J, Chu CT. Mitochondrial dysfunction in Parkinson’s disease. J Alzheimers Dis. 2010;20(Suppl 2):S325–S334. - PubMed
    1. Youle RJ, Narendra DP. Mechanisms of mitophagy. Nat Rev Mol Cell Biol. 2011;12:9–14. - PMC - PubMed
    1. Vives-Bauza C, Przedborski S. Mitophagy: The latest problem for Parkinson’s disease. Trends Mol Med. 2011;17:158–165. - PubMed

Publication types

LinkOut - more resources