. 2012 Aug;264(2):567-80.
doi: 10.1148/radiol.12112265. Epub 2012 Jun 12.

Achieving routine submillisievert CT scanning: report from the summit on management of radiation dose in CT

Affiliations

Achieving routine submillisievert CT scanning: report from the summit on management of radiation dose in CT

Cynthia H McCollough et al. Radiology. 2012 Aug.

Abstract

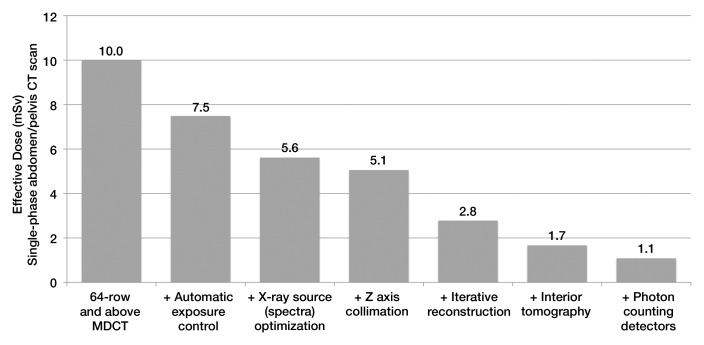
This Special Report presents the consensus of the Summit on Management of Radiation Dose in Computed Tomography (CT) (held in February 2011), which brought together participants from academia, clinical practice, industry, and regulatory and funding agencies to identify the steps required to reduce the effective dose from routine CT examinations to less than 1 mSv. The most promising technologies and methods discussed at the summit include innovations and developments in x-ray sources; detectors; and image reconstruction, noise reduction, and postprocessing algorithms. Access to raw projection data and standard data sets for algorithm validation and optimization is a clear need, as is the need for new, clinically relevant metrics of image quality and diagnostic performance. Current commercially available techniques such as automatic exposure control, optimization of tube potential, beam-shaping filters, and dynamic z-axis collimators are important, and education to successfully implement these methods routinely is critically needed. Other methods that are just becoming widely available, such as iterative reconstruction, noise reduction, and postprocessing algorithms, will also have an important role. Together, these existing techniques can reduce dose by a factor of two to four. Technical advances that show considerable promise for additional dose reduction but are several years or more from commercial availability include compressed sensing, volume of interest and interior tomography techniques, and photon-counting detectors. This report offers a strategic roadmap for the CT user and research and manufacturer communities toward routinely achieving effective doses of less than 1 mSv, which is well below the average annual dose from naturally occurring sources of radiation.


Figures

Figure 1:
Figure 1:
Bar chart shows anticipated reduction in dose owing to cumulative effect of various dose-reduction approaches for single-phase CT of the abdomen and pelvis. Data were obtained with the estimated percentage dose reductions given in the Table. For most multidetector CT (MDCT) systems with at least 64 detector rows, the effective dose to a reference adult (∼70–80 kg) is estimated to be 10 mSv. With addition of automatic exposure control systems that modulate tube current according to patient attenuation, the estimated dose reduction for a typical adult is 25%, reducing the effective dose from single-phase CT of the abdomen and pelvis to 7.5 mSv. Use of optimal x-ray spectra would further decrease effective dose by 25% to 5.6 mSv. Each successive dose-reduction approach is applied to the previous dose estimate, ordered according to the likelihood of widespread clinical availability and use. After all methods discussed herein are available clinically, the effective dose associated with this examination is anticipated to have been reduced by approximately a factor of 10, from 10 to 1.1 mSv.
Figure 2a:
Figure 2a:
(a) Graph shows iodine CNR as a function of tube potential for three phantom sizes. The same volume CT dose index was used for the four tube potentials for each phantom (small, 6.6 mGy; medium, 15.3 mGy; large, 37.0 mGy). (b) Graph shows relative dose required to match the iodine CNR as a function of tube potential for the three phantom sizes. CTDIvol = volume CT dose index.
Figure 2b:
Figure 2b:
(a) Graph shows iodine CNR as a function of tube potential for three phantom sizes. The same volume CT dose index was used for the four tube potentials for each phantom (small, 6.6 mGy; medium, 15.3 mGy; large, 37.0 mGy). (b) Graph shows relative dose required to match the iodine CNR as a function of tube potential for the three phantom sizes. CTDIvol = volume CT dose index.
Figure 3:
Figure 3:
When a detector’s response time is not sufficiently fast, the two pulses generated by detection of two nearly coincident photons may be added and recorded as one pulse. This is referred to as pulse pile up and results in loss of counts and incorrect energy data. In this example, five true photons are counted as three observed pulses. The energies assigned to the second and third pulses overestimate the true photon energies. E1, E2, and E3 are energy thresholds.
Figure 4:
Figure 4:
Axial CT image of thorax. Truncation artifacts, which appear as areas of very high attenuation at left and right edges of patient, are caused by missing projection data. This occurs when portions of the patient lie outside the irradiated VOI.
Figure 5:
Figure 5:
Diagram illustrates iterative reconstruction process (see text for detailed explanation).
Figure 6a:
Figure 6a:
(a) Illustration of VOI imaging. A physical filter reduces photon intensity to regions outside the VOI. (b) Axial CT images of abdomen. VOI image was obtained with simulation, where noise was inserted into original data set (left image) at portions of the projections associated with regions outside the VOI (right image). Dose reductions outside the VOI of 50%–65% and within the VOI of 25%–30% were able to be simulated while preserving image quality within the VOI.
Figure 6b:
Figure 6b:
(a) Illustration of VOI imaging. A physical filter reduces photon intensity to regions outside the VOI. (b) Axial CT images of abdomen. VOI image was obtained with simulation, where noise was inserted into original data set (left image) at portions of the projections associated with regions outside the VOI (right image). Dose reductions outside the VOI of 50%–65% and within the VOI of 25%–30% were able to be simulated while preserving image quality within the VOI.
Figure 7:
Figure 7:
Diagnostic performance of human or model (mathematic) observers can be quantified by using receiver operating characteristic curves, which plot sensitivity versus 1 – specificity as the observers’ detection threshold is varied. The figure of merit used to represent the quality of an imaging system or technique is the area under the receiver operating characteristic curve (AUC). Graphs show area under the receiver operating characteristic curve plotted against the applied dose for the task of detecting a large or small object. The performances of three different image reconstruction methods are compared as a function of radiation dose for standard filtered backprojection (FBP) and two different iterative reconstruction algorithms (IR1 and IR2).

Comment in

References

    1. International Commission on Radiological Protection Recommendations of the International Commission on Radiological Protection (ICRP report no. 26). Oxford, England: International Commission on Radiological Protection, 1977
    1. McCollough CH, Schueler BA. Calculation of effective dose. Med Phys 2000;27(5):828–837 - PubMed
    1. 1990 Recommendations of the International Commission on Radiological Protection. Ann ICRP 1991;21(1-3):1–201 - PubMed
    1. The 2007 Recommendations of the International Commission on Radiological Protection ICRP publication 103. Ann ICRP 2007;37(2-4):1–332 - PubMed
    1. Menzel HG, Clement C, DeLuca P. ICRP publication 110. Realistic reference phantoms: an ICRP/ICRU joint effort. A report of adult reference computational phantoms. Ann ICRP 2009;39(2):1–164 [Published correction appears in Ann ICRP 2009;39(2):165.] - PubMed

Publication types