

Use of diagnostic imaging studies and associated radiation exposure for patients enrolled in large integrated health care systems, 1996-2010
- PMID: 22692172
- PMCID: PMC3859870
- DOI: 10.1001/jama.2012.5960
Use of diagnostic imaging studies and associated radiation exposure for patients enrolled in large integrated health care systems, 1996-2010
Abstract
Context: Use of diagnostic imaging has increased significantly within fee-for-service models of care. Little is known about patterns of imaging among members of integrated health care systems.
Objective: To estimate trends in imaging utilization and associated radiation exposure among members of integrated health care systems.
Design, setting, and participants: Retrospective analysis of electronic records of members of 6 large integrated health systems from different regions of the United States. Review of medical records allowed direct estimation of radiation exposure from selected tests. Between 1 million and 2 million member-patients were included each year from 1996 to 2010.
Main outcome measure: Advanced diagnostic imaging rates and cumulative annual radiation exposure from medical imaging.
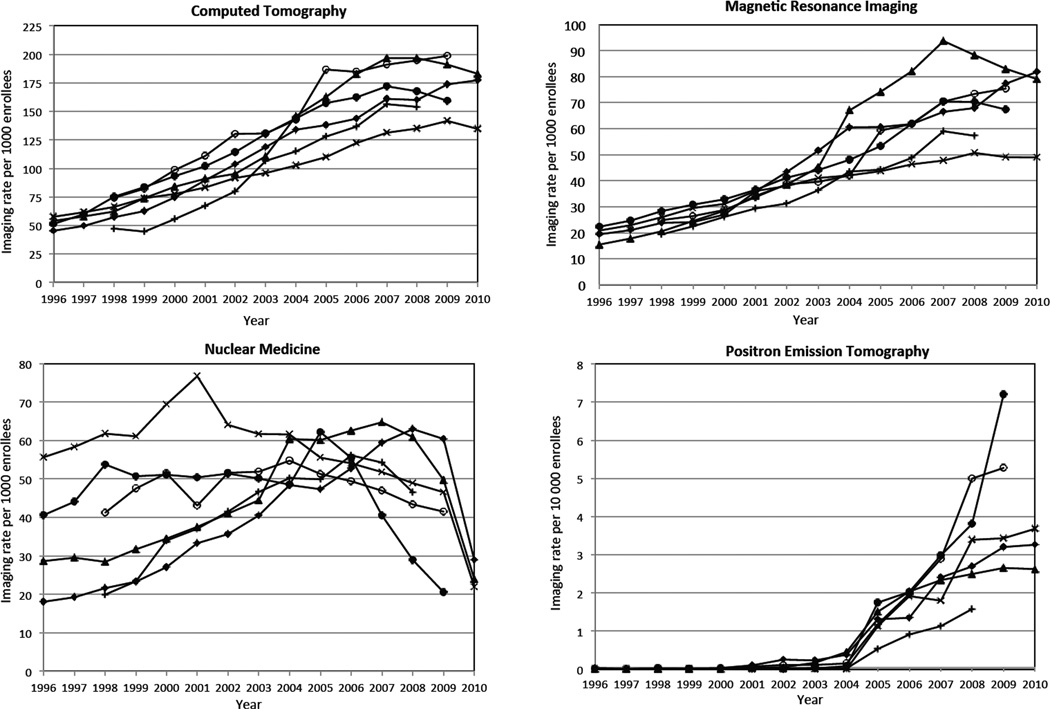
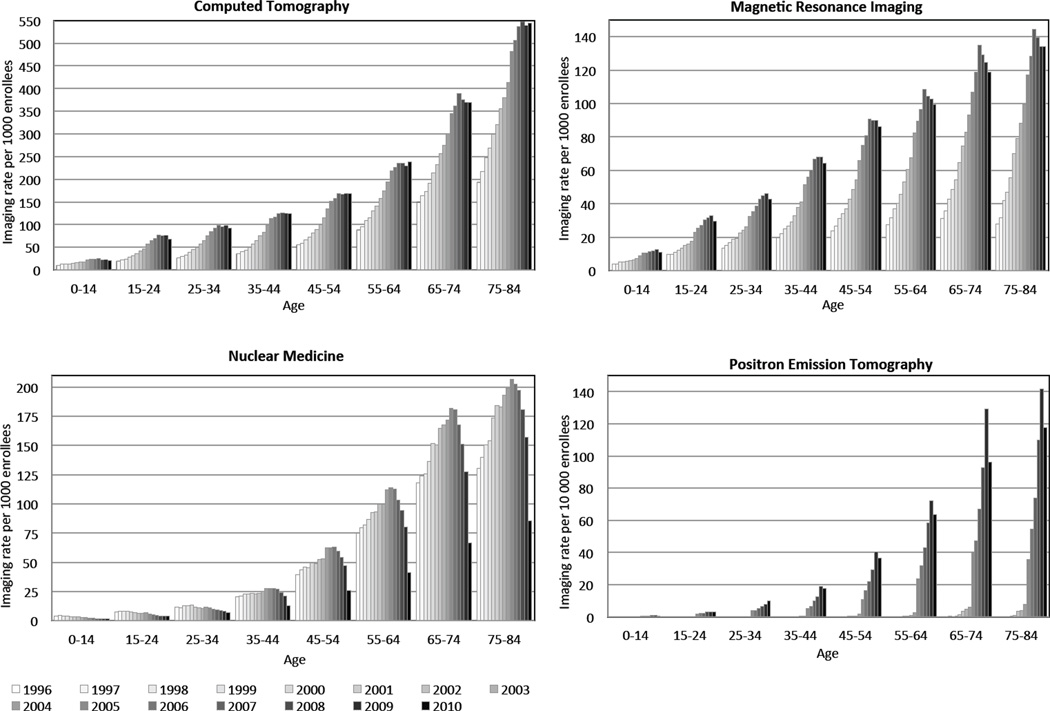
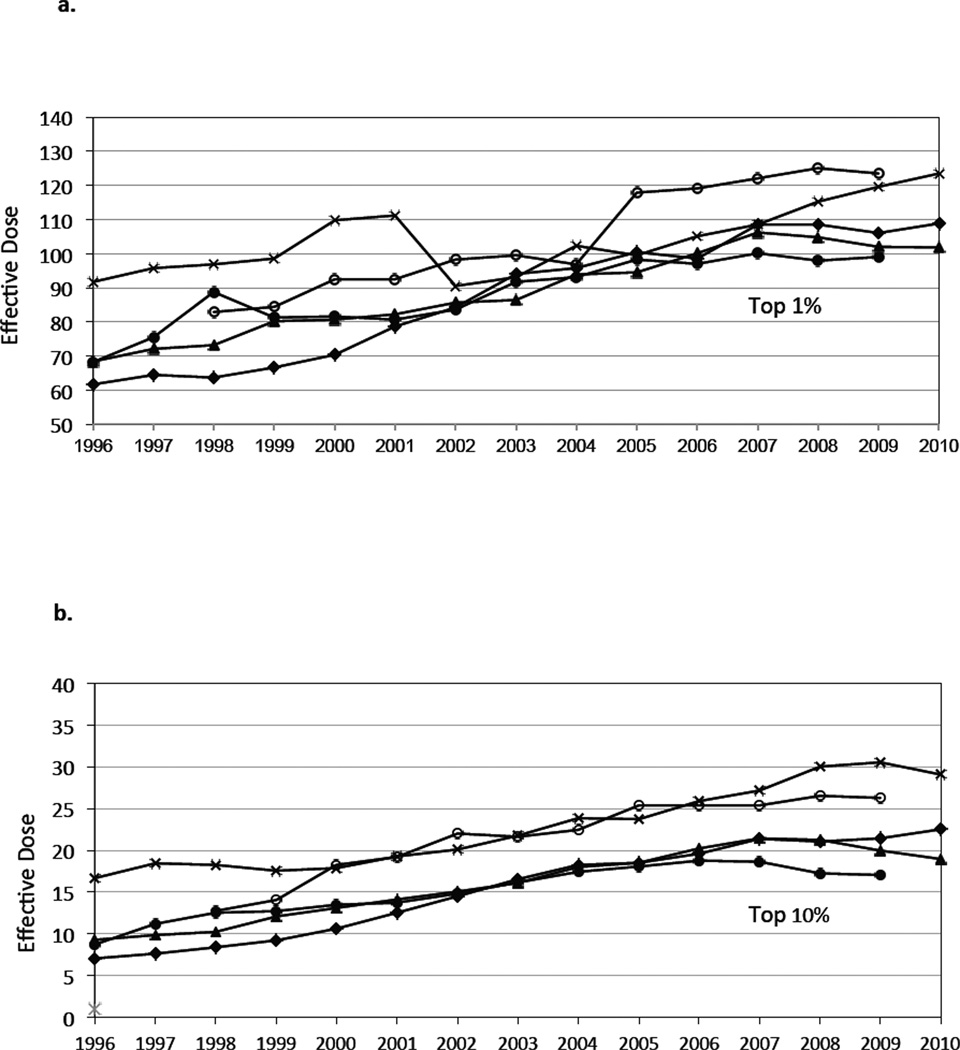
Results: During the 15-year study period, enrollees underwent a total of 30.9 million imaging examinations (25.8 million person-years), reflecting 1.18 tests (95% CI, 1.17-1.19) per person per year, of which 35% were for advanced diagnostic imaging (computed tomography [CT], magnetic resonance imaging [MRI], nuclear medicine, and ultrasound). Use of advanced diagnostic imaging increased from 1996 to 2010; CT examinations increased from 52 per 1000 enrollees in 1996 to 149 per 1000 in 2010, 7.8% annual increase (95% CI, 5.8%-9.8%); MRI use increased from 17 to 65 per 1000 enrollees, 10% annual growth (95% CI, 3.3%-16.5%); and ultrasound rates increased from 134 to 230 per 1000 enrollees, 3.9% annual growth (95% CI, 3.0%-4.9%). Although nuclear medicine use decreased from 32 to 21 per 1000 enrollees, 3% annual decline (95% CI, 7.7% decline to 1.3% increase), PET imaging rates increased after 2004 from 0.24 to 3.6 per 1000 enrollees, 57% annual growth. Although imaging use increased within all health systems, the adoption of different modalities for anatomic area assessment varied. Increased use of CT between 1996 and 2010 resulted in increased radiation exposure for enrollees, with a doubling in the mean per capita effective dose (1.2 mSv vs 2.3 mSv) and the proportion of enrollees who received high (>20-50 mSv) exposure (1.2% vs 2.5%) and very high (>50 mSv) annual radiation exposure (0.6% vs 1.4%). By 2010, 6.8% of enrollees who underwent imaging received high annual radiation exposure (>20-50 mSv) and 3.9% received very high annual exposure (>50 mSv).
Conclusion: Within integrated health care systems, there was a large increase in the rate of advanced diagnostic imaging and associated radiation exposure between 1996 and 2010.
Conflict of interest statement
Figures
Comment in
-
Lung cancer screening, radiation, risks, benefits, and uncertainty.JAMA. 2012 Jun 13;307(22):2434-5. doi: 10.1001/jama.2012.6096. JAMA. 2012. PMID: 22692175 No abstract available.
References
-
- Statement of Glenn M. Hackbarth, Chairman, Medicare Payment Advisory Commission, Testimony Before the Subcommittee on Health of the House Committee on Ways and Means, May 10, 2007. [accessed July 30, 2008]; available online http://waysandmeans.house.gov/hearings.asp?formmode=printfriendly&id=5893.
-
- Government Accountability Office. Report to Congressional requesters: Medicare Part B imaging services: rapid spending growth and shift to physician offices indicated need for CMS to consider additional management practices. In: Office GA, editor. Vol. Washington, DC: 2008. GAO-08-452.
-
- Winter A, Stensland J. Introduction to expert panel on new research on use of imaging services: presentation to Medicare Payment Advisory COmmission. Washingto, DC: 2008. Spetember. 2008.
-
- Iglehart JK. Health insurers and medical-imaging policy--a work in progress. N Engl J Med. 2009 Mar 5;360(10):1030–1037. - PubMed
-
- Health Risks from Exposure to Low Levels of Ionizing Radiation: BEIR VII Phase 2. Washington, D.C.: The National Academies Press; 2006. Board of Radiation Effects Research Division on Earth and Life Sciences National Research Council of the National Academies. - PubMed
Publication types
MeSH terms
Grants and funding
LinkOut - more resources
Full Text Sources
Other Literature Sources
Medical
