. 2012 Aug 3;287(32):26688-701.
doi: 10.1074/jbc.M112.378588. Epub 2012 Jun 12.

Activation of transient receptor potential canonical 3 (TRPC3)-mediated Ca2+ entry by A1 adenosine receptor in cardiomyocytes disturbs atrioventricular conduction

Affiliations

Activation of transient receptor potential canonical 3 (TRPC3)-mediated Ca2+ entry by A1 adenosine receptor in cardiomyocytes disturbs atrioventricular conduction

Jessica Sabourin et al. J Biol Chem. .

Abstract

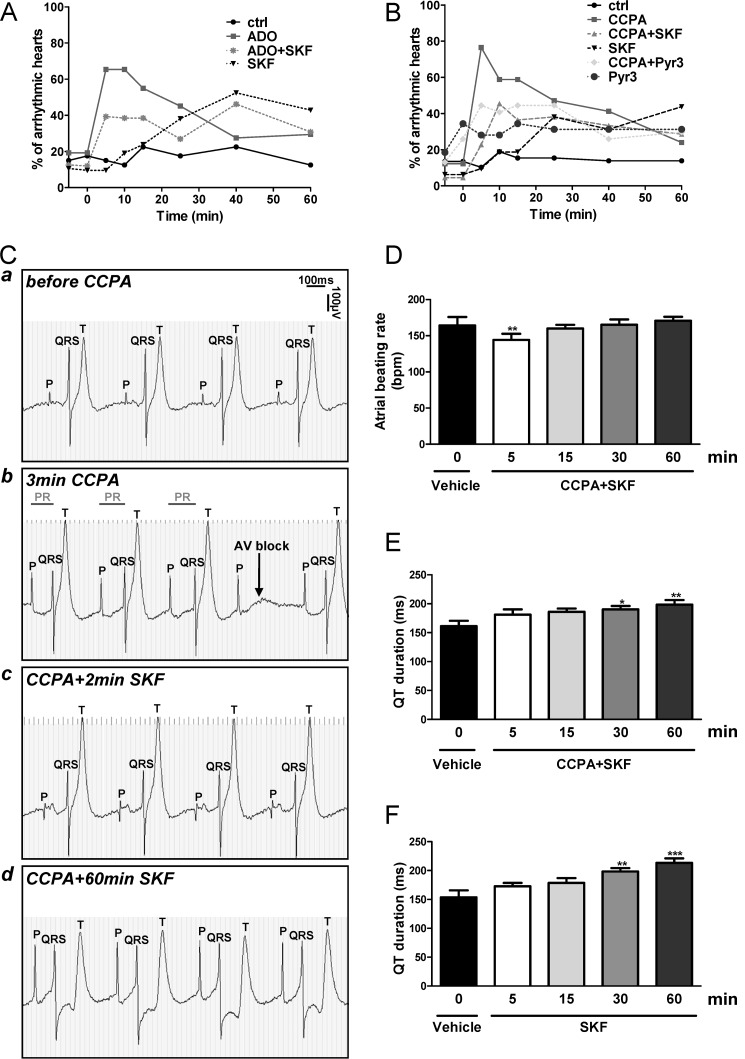
Although the activation of the A(1)-subtype of the adenosine receptors (A(1)AR) is arrhythmogenic in the developing heart, little is known about the underlying downstream mechanisms. The aim of this study was to determine to what extent the transient receptor potential canonical (TRPC) channel 3, functioning as receptor-operated channel (ROC), contributes to the A(1)AR-induced conduction disturbances. Using embryonic atrial and ventricular myocytes obtained from 4-day-old chick embryos, we found that the specific activation of A(1)AR by CCPA induced sarcolemmal Ca(2+) entry. However, A(1)AR stimulation did not induce Ca(2+) release from the sarcoplasmic reticulum. Specific blockade of TRPC3 activity by Pyr3, by a dominant negative of TRPC3 construct, or inhibition of phospholipase Cs and PKCs strongly inhibited the A(1)AR-enhanced Ca(2+) entry. Ca(2+) entry through TRPC3 was activated by the 1,2-diacylglycerol (DAG) analog OAG via PKC-independent and -dependent mechanisms in atrial and ventricular myocytes, respectively. In parallel, inhibition of the atypical PKCζ by myristoylated PKCζ pseudosubstrate inhibitor significantly decreased the A(1)AR-enhanced Ca(2+) entry in both types of myocytes. Additionally, electrocardiography showed that inhibition of TRPC3 channel suppressed transient A(1)AR-induced conduction disturbances in the embryonic heart. Our data showing that A(1)AR activation subtly mediates a proarrhythmic Ca(2+) entry through TRPC3-encoded ROC by stimulating the phospholipase C/DAG/PKC cascade provide evidence for a novel pathway whereby Ca(2+) entry and cardiac function are altered. Thus, the A(1)AR-TRPC3 axis may represent a potential therapeutic target.


Figures

FIGURE 1.
FIGURE 1.
Characterization of cultured embryonic cardiomyocytes. A, atrial and ventricular myocytes isolated from 4-day-old embryonic chick heart after 72 h in culture. Two representative images obtained with phase-contrast microscopy show the morphology of spontaneously beating atrial (left) and ventricular (right) myocytes. Scale bars, 10 μm. B, immunostaining for cTnI in red and the nucleus in blue in atrial (left) and ventricular (right) myocytes showing characteristic sarcomeric striations (n = 3 primary cultures). Stars represent the selected areas enlarged (×2) showing striations. Scale bars, 1 μm. C, Western blotting showing the presence of cTnI (21 kDa) in cultured atrial and ventricular myocytes (n = 3 primary cultures).Whole 4-day-old embryonic heart was used as positive control.
FIGURE 2.
FIGURE 2.
Expression of TRPC isoforms and A1AR. A, TRPC1, TRPC3–7 proteins were expressed in cultured atrial and ventricular myocytes as well as in whole heart as the positive control (n = 3 primary cultures). B, A1AR mRNA was identified by RT-PCR in cultured myocytes and whole heart (n = 2 primary cultures). PCR product of the predicted size was 318 bp. β-Actin was amplified as a positive control. The negative control (Ctrl(−)) contained water instead of DNA.
FIGURE 3.
FIGURE 3.
Contribution of TRPC channels to CCPA-induced sarcolemmal Ca2+ influx. A and B, cytosolic Ca2+ changes determined from Fura-2 fluorescence ratio (340/380) as described under “Experimental Procedures.” Left panels, representative traces of the Ca2+ entry in atrial (A) and ventricular (B) myocytes in basal conditions (basal, black traces), after A1AR stimulation by 50 μm CCPA (dark gray traces), and in the presence of CCPA + 40 μm SKF (light gray traces). Right panels, corresponding bar graphs representing the mean maximal amplitude of the Ca2+ response in each condition (n = 3 primary cultures; number of investigated cells ranged from 44 to 232). ***, p < 0.001. C and D, sarcolemmal cation influx determined by adding 500 μm Mn2+ to the medium to quench the Fura-2 fluorescence as described under “Experimental Procedures.” Left panels, Mn2+-induced rapid decrease of Fura-2 fluorescence (F) calculated from the initial slope (ΔFt in %) in atrial (C) and ventricular (D) myocytes in basal conditions (basal, black traces), after A1AR stimulation by 50 μm CCPA (dark gray traces), and in the presence of CCPA + 40 μm SKF (light gray traces). Right panels, corresponding bar graphs representing the cation entry in each condition (n = 3–8 primary cultures; number of investigated cells ranged from 68 to 248). *, p < 0.05. In A–D, the Ca2+ entry was normalized to the respective basal influx.
FIGURE 4.
FIGURE 4.
CCPA-induced sarcolemmal cation influx through TRPC3 channel in a store-independent mechanism. A, bar graphs represent the effects of 40 μm SKF, 10 μm BTP2, 10 μm Pyr3, transient transfection of an empty plasmid (pmaxGFP), and DN-TRPC3 on A1AR-stimulated cation entry in atrial and ventricular myocytes (n = 3–6 primary cultures; number of investigated cells ranged from 46 to 194). ns, not significant; **, p < 0.01; ***, p < 0.001 versus CCPA. B, cells were transiently transfected with the SR-targeted cameleon probe D1ER. Images illustrate staining for cTnI (in red) and D1ER fluorescence (in green) in atrial and ventricular myocytes. Scale bars represent 5 μm. Representative traces show the time course of normalized D1ER ratio changes in four atrial and eight ventricular cells in response to 50 μm CCPA and 1 μm thapsigargin (Tg) in Ca2+-free medium. A1AR activation by CCPA did not induce detectable SR Ca2+ depletion.Values were normalized to the signal obtained before CCPA (n = 3 primary cultures; number of investigated cells ranged from 11 to 18).
FIGURE 5.
FIGURE 5.
Contribution of PLC/DAG/PKC pathway to CCPA-induced sarcolemmal cation influx. A, bar graphs represent the effects of 5 μm U73122, 5 μm U73343, 10 μm chelerythrine (chele), and 1 μm Ro 31-8220 (Ro 31) on A1AR-stimulated cation entry in atrial and ventricular myocytes (n = 3–6 primary cultures; number of investigated cells ranged from 41 to 179). ns, not significant; ***, p < 0.001 versus CCPA. B, in atrial cells pretreated with the PLCs inhibitor U73122 and stimulated with CCPA, only 100 μm OAG partly restored the cation entry. In pretreated ventricular cells, both OAG and 1 μm PMA restored the cation entry. 10 μm Pyr3 abolished the OAG- and/or PMA-induced restoration of cation entry in atrial and ventricular myocytes (n = 3–4 primary cultures; number of investigated cells ranged from 36 to 183). ns, not significant; *, p < 0.05 versus CCPA+U73122. C, bar graphs represent the effect of 25 μm MPI-PKCζ on A1AR-stimulated cation entry in atrial and ventricular myocytes (n = 3 primary cultures; number of investigated cells ranged from 46 to 90). **, p < 0.01 atrial versus ventricular cells; ***, p < 0.001 versus CCPA. In A–C, cation entry was normalized to that induced by CCPA alone. In A and B, all inhibitors, activators, U73343, and OAG were added 3 min before CCPA. In C, the myocytes were pretreated with the peptide MPI-PKCζ 30 min before CCPA.
FIGURE 6.
FIGURE 6.
Inhibition of all TRPC isoforms suppressed the A1AR-induced conduction disturbances. A and B, the transient arrhythmogenic effect of ADO (A) or CCPA (B) was reduced by SKF and Pyr3. Time 0 is the time point just before introduction of the 100 μm ADO or 10 μm CCPA after 5 min of pretreatment with 5 μm SKF or 10 μm Pyr3. Controls are untreated hearts. n = 26–54 whole hearts for each condition. C, representative ECG recording shows the P, QRS, and T components of the same embryonic heart spontaneously beating ex vivo before (a) and after 3 min exposure to 10 μm CCPA (b). CCPA mainly provoked second-degree atrioventricular blocks (Wenckebach phenomenon) which were rapidly suppressed by addition of 5 μm SKF (c) for at least 60 min (d) (n = 5 independent experiments, see also supplemental Fig. 4A). D shows time-dependent effect of 10 μm CCPA + 5 μm SKF on atrial beating rate (n = 4). **, p < 0.01 versus vehicle. E and F show time-dependent effects of 10 μm CCPA + 5 μm SKF (E) or 5 μm SKF alone (F) on QT duration (n = 3–4). *, p < 0.05; **, p < 0.01; ***, p < 0.001 versus vehicle.
FIGURE 7.
FIGURE 7.
Inhibition of TRPC3 isoform suppressed the A1AR-induced conduction disturbances. Representative ECG recording showing that arrhythmias induced by CCPA after 3 min (b) were suppressed within 4 min by Pyr3 (5 μm) (c) for at least 60 min (d) (n = 5 independent experiments, see also supplemental Fig. 4B).
FIGURE 8.
FIGURE 8.
Proposed model of A1AR-induced ROCE through TRPC3 in atrial (A) and ventricular (B) myocytes. The A1AR-induced Ca2+ entry through TRPC3 channel requires the upstream activation of PLC/DAG pathway in atrial and ventricular myocytes. The atypical PKCζ predominant in atrial myocytes and the novel PKCs predominant in ventricular myocytes are crucial for regulating TRPC3 activity. Increased ROCE via TRPC3 appears to be involved in conduction disturbances induced by A1AR stimulation in the developing heart. PIP2, phosphatidylinositol 4,5-bisphosphate; aPKC, atypical PKC; nPKC, novel PKC.

References

    1. Görlach A. (2005) Control of adenosine transport by hypoxia. Circ. Res. 97, 1–3 - PubMed
    1. Takahashi T., Otsuguro K., Ohta T., Ito S. (2010) Adenosine and inosine release during hypoxia in the isolated spinal cord of neonatal rats. Br. J. Pharmacol. 161, 1806–1816 - PMC - PubMed
    1. Peart J., Headrick J. P. (2000) Intrinsic A1 adenosine receptor activation during ischemia or reperfusion improves recovery in mouse hearts. Am. J. Physiol. Heart Circ. Physiol. 279, H2166–2175 - PubMed
    1. Roscoe A. K., Christensen J. D., Lynch C., 3rd (2000) Isoflurane, but not halothane, induces protection of human myocardium via adenosine A1 receptors and adenosine triphosphate-sensitive potassium channels. Anesthesiology 92, 1692–1701 - PubMed
    1. Cerniway R. J., Morrison R. R., Byford A. M., Lankford A. R., Headrick J. P., Van Wylen D. G., Matherne G. P. (2002) A1 adenosine receptor overexpression decreases stunning from anoxia-reoxygenation: role of the mitochondrial KATP channel. Basic Res. Cardiol. 97, 232–238 - PubMed

Publication types