. 2012 Jun 12:3:896.
doi: 10.1038/ncomms1899.

The translation inhibitor pateamine A prevents cachexia-induced muscle wasting in mice

Affiliations
Free PMC article

The translation inhibitor pateamine A prevents cachexia-induced muscle wasting in mice

Sergio Di Marco et al. Nat Commun. .
Free PMC article

Abstract

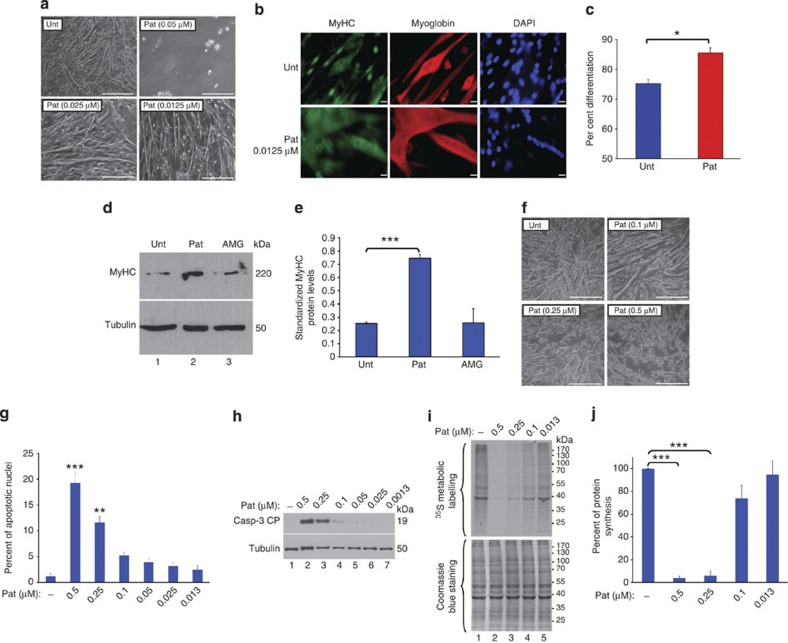
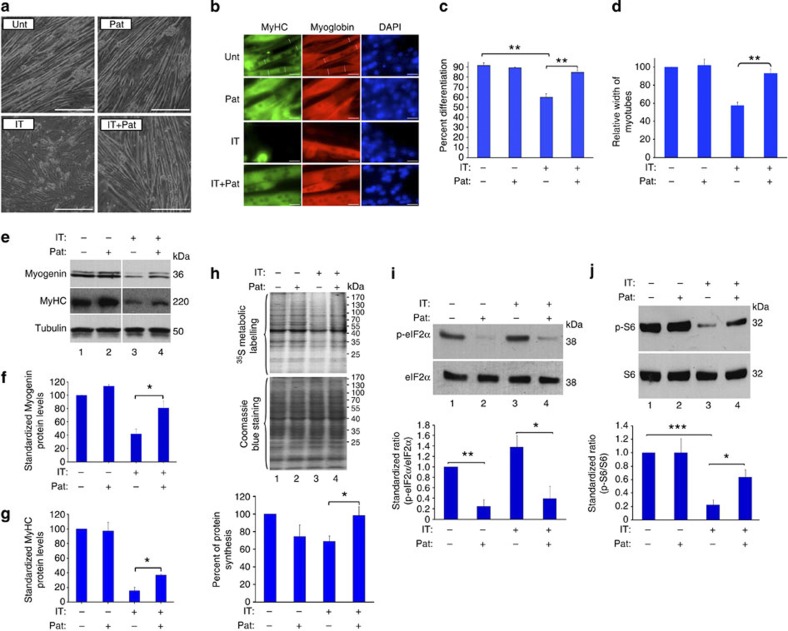
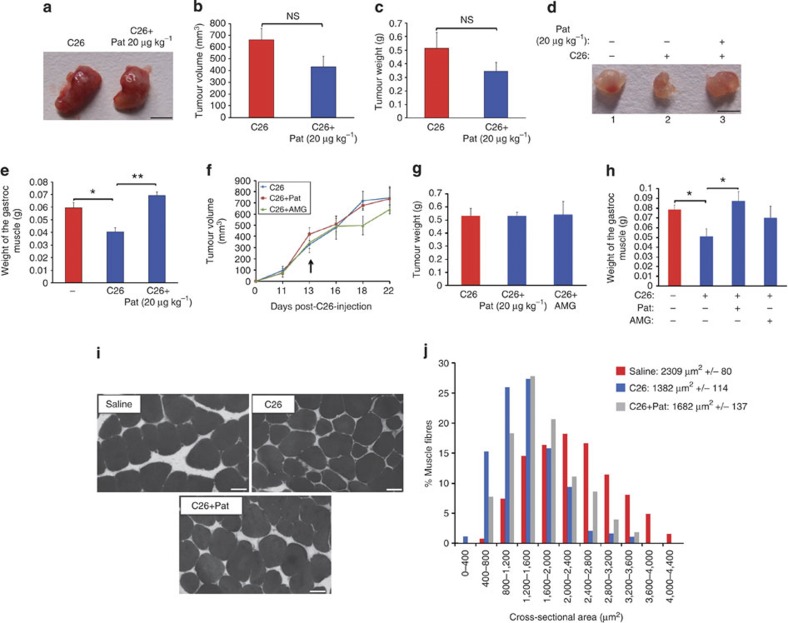
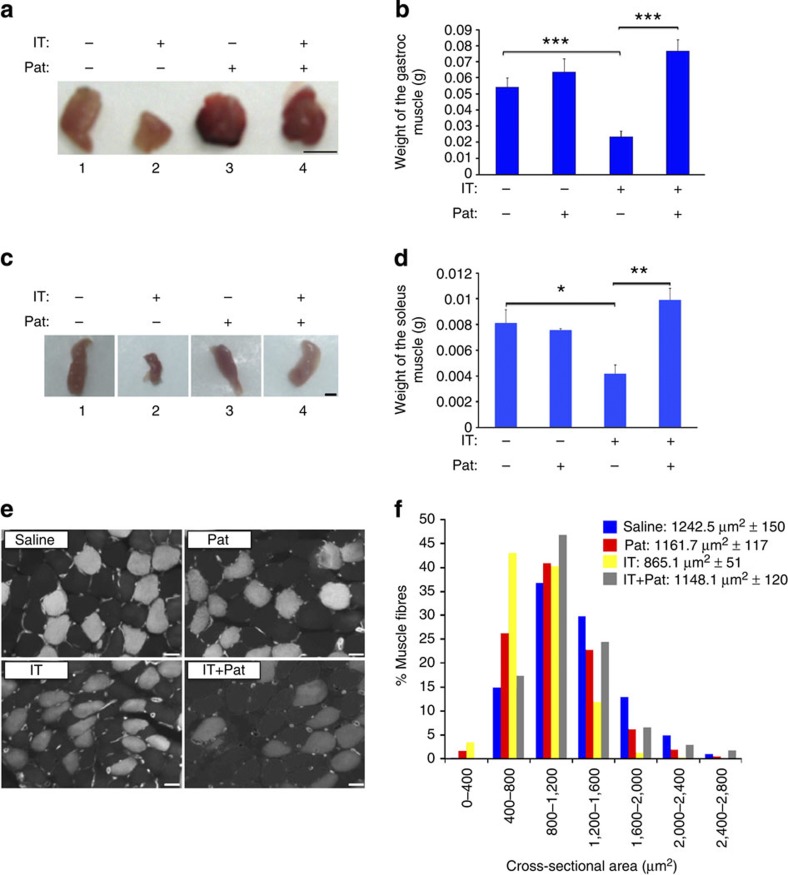
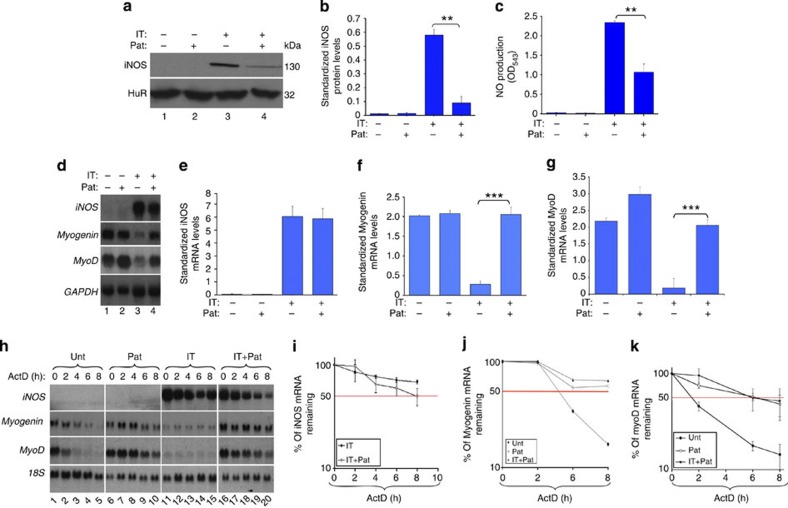
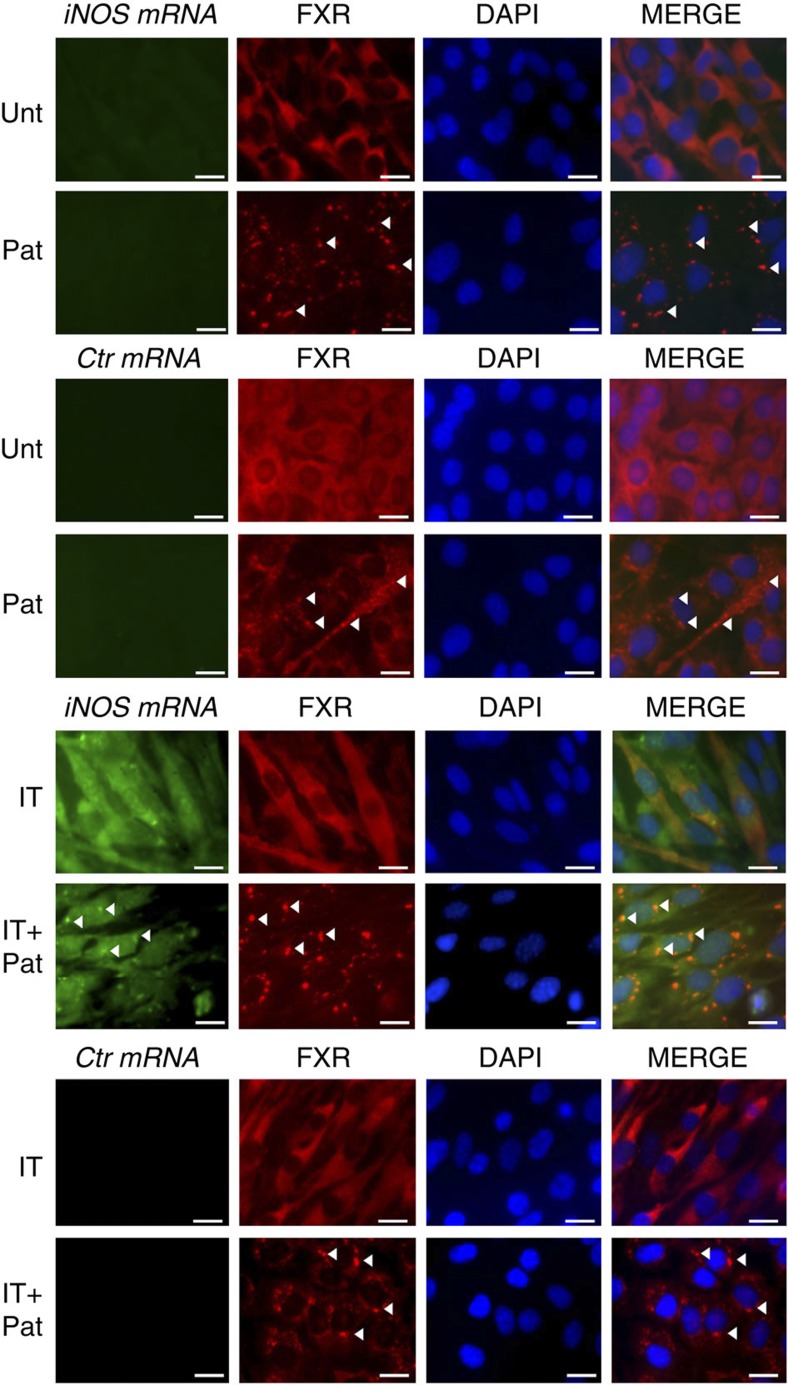
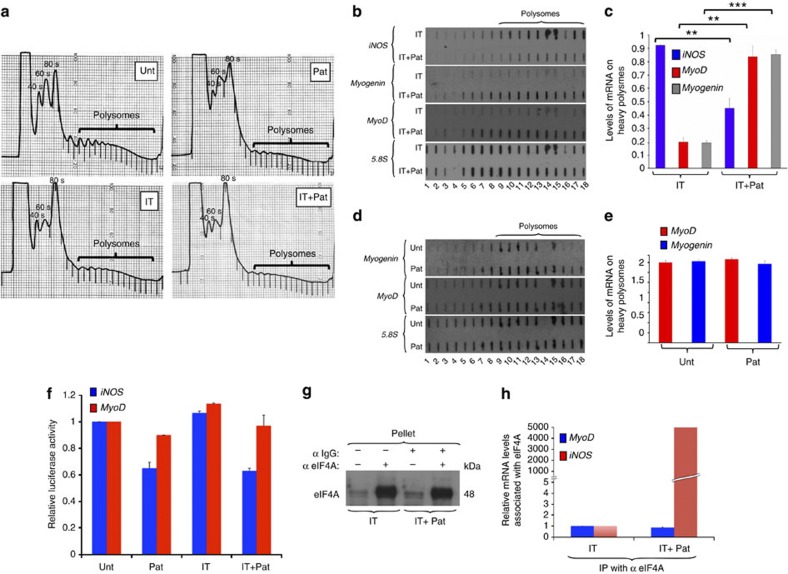
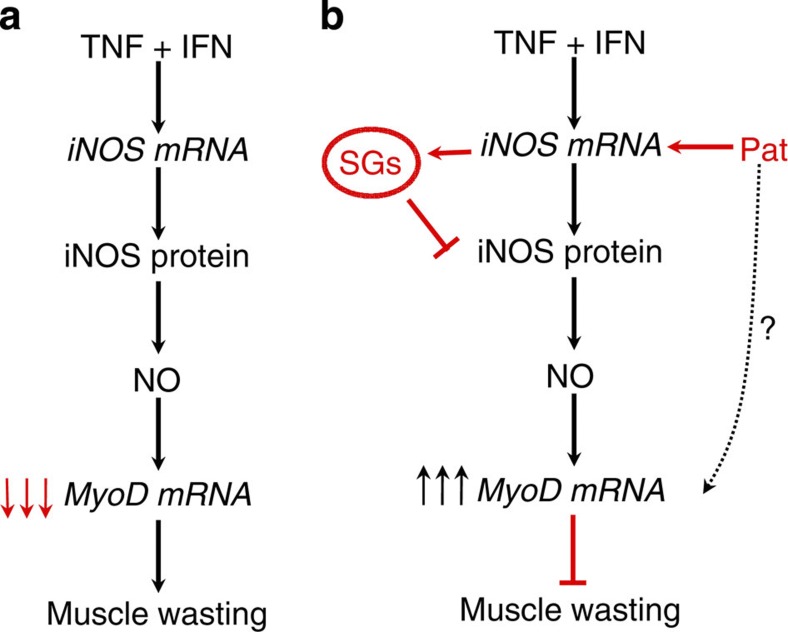
Cachexia, or muscle-wasting syndrome, is one of the major causes of death in patients affected by diseases such as cancer, AIDS and sepsis. However, no effective anti-cachectic treatment is currently available. Here we show that a low dose of pateamine A, an inhibitor of translation initiation, prevents muscle wasting caused by the cytokines interferon γ and tumour necrosis factor α or by C26-adenocarcinoma tumours. Surprisingly, although high doses of pateamine A abrogate general translation, low doses selectively inhibit the expression of pro-cachectic factors such as inducible nitric oxide synthase. This selectivity depends on the 5'UTR of inducible nitric oxide synthase messenger RNA (mRNA) that, unlike the 5'UTR of MyoD mRNA, promotes the recruitment of inducible nitric oxide synthase mRNA to stress granules, where its translation is repressed. Collectively, our data provide a proof of principle that nontoxic doses of compounds such as pateamine A could be used as novel drugs to combat cachexia-induced muscle wasting.


Conflict of interest statement

We declare that the authors have no competing interests as defined by Nature Publishing Group, or other interests that might be perceived to influence the results and/or discussion reported in this article.

Figures

Figure 1
Figure 1. Low doses of PatA are not detrimental to muscle fibres (ae).
Low doses of PatA promote myogenesis. (a) Phase-contrast images of myofibres that were treated during the differentiation process with or without the indicated concentrations of PatA for 96 h. Images are representative of three independent experiments. Bars, 50 μM. (b) Myotubes formed in the presence or absence of 0.0125 μM PatA were used for immunofluorescence analysis with anti-myoglobin and anti-MyHC antibodies. Bars, 20 μm. (c) Graph depicting the fusion index of muscle fibres seen in b from at least three fields from three independent experiments±s.e.m. *P<0.05 (Student's t-test). (d) Western blot analysis of MyHC protein levels in myofibres treated with or without 0.0125 μM PatA or 100 μM AMG. Tubulin protein levels are included as a loading control. (e) The MyHC levels in the western blot (d) were quantified, normalized against Tubulin protein levels and plotted±s.e.m. from three independent experiments. ***P<0.001 (Student's t-test). (f–h) Low doses of PatA do not affect the integrity of muscle fibres. (f) Phase-contrast images of myofibres assessed 24 h post-treatment with different doses of PatA. Images are representative of three independent experiments. Bars, 50 μm. (g) Myofibres were stained with DAPI to visualize apoptotic nuclei. Values are presented as percentages±s.e.m. of three independent experiments. **P<0.01, ***P<0.001 (Student's t-test). (h) Western blot analysis of caspase 3 cleavage product (indicative of apoptosis) in myofibres treated with different doses of PatA. Tubulin protein levels were included as a loading control. Immunoblots are representative of three independent experiments. (i,j) PatA inhibits protein synthesis in a dose-dependent manner. Myofibres treated with different concentrations of PatA were assessed for de novo protein synthesis. (i) The de novo synthesis of protein was detected by autoradiography (top panel). Coomassie blue staining of gels were performed to assess total protein levels (lower panel). (j) The effect of PatA on protein synthesis detected by autoradiography was standardized (using the total protein content obtained from Coomassie blue staining) and plotted as a percentage±the s.e.m. from four independent experiments. ***P<0.001 (Student's t-test).
Figure 2
Figure 2. PatA prevents IFNγ/TNFα-induced muscle wasting.
(a–g) Effect of PatA on myofibres exposed to cytokines. (a) Phase-contrast images demonstrating the effect of 0.1 μM PatA on myofibres treated with or without IFNγ (100 U ml−1) and TNFα (20 ng ml−1) for 72–96 h. Bars, 50 μm. Images are representative of four independent experiments. (b) Myotubes treated with or without IFNγ (100U ml−1) and TNFα (20 ng ml−1) in the presence or absence of 0.1 μM PatA were used for immunofluorescence analysis with anti-myoglobin and MyHC antibodies. Bars, 20 μm. (c) Graph depicting the fusion index of muscle fibres seen in (b) from at least three fields from three independent experiments±s.e.m. **P<0.01 (Student's t-test). (d) The mean diameter of the fibres seen in (b) (see white lines in panels for examples of diameters measured) was determined and represented on the graph as a percentage relative to the diameter of untreated myofibres±s.e.m. of three independent experiments. **P<0.01 (Student's t-test). (e) Western blot analysis of Myogenin and MyHC protein levels in myofibres treated with or without 0.1 μM Pat in the presence or absence of IFNγ/TNFα. (f,g) The Myogenin or MyHC protein levels, described above, were quantified using ImageQuant, normalized against the loading control and plotted±the s.e.m. from three independent experiments. *P<0.05 (Student's t-test). (h–j) PatA rescues the decrease in protein synthesis that occurs in IFNγ/TNFα-treated C2C12 muscle fibres. (h) De novo protein synthesis was determined as described in Fig. 1i–j by plotting the average percentage values±the s.e.m. from four independent experiments. *P<0.05 (Student's t-test). (i,j) Western blot analysis of phospho-eIF2α (i, top panel) and phospho-S6 (j, top panel) levels in myofibres collected 24 h after treatment with or without 0.1 μM PatA in the presence or absence of IFNγ/TNFα. Total eIF2α and S6levels were used as a loading control. The phospho-eIF2α and phospho-S6levels were quantified, normalized against eIF2α level and S6 level, respectively, and plotted±the s.e.m. from 3 independent experiments (bottom panels). *P<0.05, **P<0.01, ***P<0.001 (Student's t-test).
Figure 3
Figure 3. PatA suppresses tumour-induced muscle wasting in BALB/c mice injected with C26 adenocarcinoma cells.
(a–e) Injection of mice with 20 μg kg−1 PatA 6 days post-injection of C26 adenocarinoma cells prevents muscle wasting without affecting tumour growth. Mice were treated with or without 20 μg kg−1 of PatA starting at 6 days post-injection of C26 cells and every second day thereafter. Mice were subsequently killed 19 days after the injection of C26 cells. (a) Photographs of the tumours are representative of n=3 mice per sample group. Bars, 5 mm. Tumour volume (b) and weight (c)±s.e.m. were measured for 3 mice per group. NS refers to non-significance. (d) Photograph and (e) weight of gastrocnemius muscles isolated from mice described above. Photographs in d are representative of n=3 mice, Bars, 5 mm. Weights in e are presented±s.e.m. from n=3 mice per group. *P<0.05, **P<0.01 (Student's t-test). (f–j) Injection of 20 μg kg−1 PatA in C26 tumour-bearing mice prevents muscle atrophy. (f) Effect of 20 μg kg−1 PatA or 50 mg kg−1 AMG on the growth of C26 tumours. Tumour volumes were calculated over a 3-week period. PatA or AMG was only injected into mice on day 13 (indicated on graph by a black arrow) when tumours became palpable and every second day thereafter. The mice were killed on day 22 after the injection of C26 cells. Volumes are presented as ±s.e.m. from n=3 mice. (g) Weight of tumours and (h) gastrocnemius muscles isolated from mice 22 days post-C26 injection treated or not with 20 μg kg−1 of PatA or 50 mg kg−1 AMG, as described above. Weights are presented ±s.e.m. from n=3 mice per group. (h) *P<0.05 (Student's t-test). (i) Immunohistochemical staining of gastrocnemius muscle fibres isolated from saline as well as C26 tumour-bearing mice treated with or without PatA, as described above. Bars, 20 μm. (j) The cross-sectional area of muscle fibres described in i are represented as a frequency histogram from n=2 mice. The mean cross-sectional area of the fibres is indicated in the histogram±s.e.m.
Figure 4
Figure 4. PatA prevents the loss of muscle in mice injected intramuscularly with IFNγ/TNFα.
(a–d) Effect of PatA on IFNγ/TNFα-treated gastrocnemius and soleus muscles. Photograph (a) and weight (b) of gastrocnemius muscle isolated from mice, 5 days after injection, with or without IFNγ and TNFα in the presence or absence of 20 μg kg−1 of PatA. Bars in a, 5 mm. Weights in b are plotted±s.e.m. from n=9 mice. ***P<0.001 (Student's t-test). Photograph (c) and weight (d) of soleus muscle isolated from mice treated, as described above. Bars in c, 1 mm. Weights in d are plotted ±s.e.m. from n=3 mice. *P<0.05, **P<0.01 (Student's t-test). (e) Immunohistochemical staining was performed, as described in Figure 3, on soleus muscle fibres isolated from mice injected with IFNγ and TNFα in the presence or absence of 20 μg kg−1 of PatA. Bars, 20 μm. (f) The cross-sectional area of muscle fibres obtained from the muscles in e are represented as a frequency histogram from n=3 mice. The mean cross-sectional area of the fibres is indicated in the histrogram±s.e.m.
Figure 5
Figure 5. PatA differentially regulates the expression of iNOS and MyoD in cytokine-treated myofibres.
(a–c) PatA significantly reduces iNOS protein level and NO release. (a) Western blot analysis using an antibody detecting iNOS was performed to determine the effect of (0.1 μM) PatA on iNOS protein expression in cytokine-treated muscle fibres. HuR protein levels are included as loading controls. (b) The iNOS protein levels above were quantified, normalized against the HuR protein levels and plotted ± the s.e.m. from three independent experiments. **P<0.01 (Student's t-test). (c) NO release by C2C12 myofibres was assessed with GRIESS reagent 24 h after treatment with or without PatA in the presence or absence of IFNγ/TNFα, as described above. NO levels are plotted±the s.e.m. from three independent experiments. **P<0.01 (Student's t-test). (d–k) Unlike the MyoD and Myogenin mRNA, the steady-state levels and half-life of the iNOS mRNAs are not affected by PatA. (d) Total mRNA was collected from myofibres treated, as described above, and analysed by northern blot to determine iNOS, MyoD and Myogenin mRNA levels. iNOS (e), Myogenin (f) and MyoD (g) mRNA levels, quantified using the ImageQuant software and standardized against GAPDH mRNA levels, were plotted±the s.e.m. from three independent experiments. (f, g) ***P<0.001 (Student's t-test). (h) The stability of the iNOS, MyoD and Myogenin mRNAs was determined by incubating the above stated fibres with 5 μg ml−1 of ActD for the indicated periods of time, and the level of iNOS, MyoD and Myogenin mRNAs was determined by northern blot analysis. The stability of iNOS (i), Myogenin (j) and MyoD (k) mRNAs was quantified, as described above, using the ImageQuant software program. Levels were then standardized against 18S rRNA levels and plotted as the percentage±the s.e.m. of three independent experiments of remaining mRNA compared with message levels at the 0 h time point (where there is a 100% maximum mRNA level).
Figure 6
Figure 6. The iNOS mRNA is recruited to SGs in IFNγ/TNFα-treated C2C12 cells in the presence of PatA.
Differentiated C2C12 myofibres were treated with or without (0.1 μM) PatA in the presence or absence of IFNγ/TNFα. After a period of 24 h, the fibres were fixed, permeabilized and incubated with an anti-sense or sense probe (used as a control probe) to detect iNOS mRNA. DAPI staining and immunostaining against FXR1 were performed to visualize the nucleus and the SGs, respectively. White arrows point to SGs. The results shown are representative of three independent experiments. Bars, 20 μm.
Figure 7
Figure 7. PatA differentially affects the translation of iNOS, Myogenin and MyoD mRNAs in cytokine-treated myofibres.
(a) Polysome profiles of sucrose fractions obtained from total cell extracts of myofibres treated with or without PatA in the presence or absence of IFNγ/TNFα. (b) The iNOS, Myogenin and MyoD mRNA levels in the fractions, described above, were analysed by slot blot. 5.8S rRNA was included as a loading control. (c) The levels of iNOS, Myogenin and MyoD mRNAs in b were quantified using the ImageQuant software, standardized against 5.8S mRNA and plotted±the s.e.m. from 3 independent experiments. **P<0.01, ***P<0.001 (Student's t-test). (d,e) MyoD and Myogenin mRNA levels in polysome fractions obtained from untreated and PatA-treated cells were assessed by slot blot (d) and quantified (e), as described above in c. (f) PatA affects the translation of a luciferase reporter containing the iNOS but not the MyoD 5′UTR. Firefly luciferase reporter mRNA containing either the iNOS or MyoD 5′UTR were transfected into muscle cells treated with or without IFNγ/TNFα in the presence or absence of PatA for 24 h. Luciferase activity was subsequently measured, normalized against a co-transfected Renilla luciferase reporter and presented±the s.e.m. of two replicates relative to the untreated samples. (g,h) PatA promotes the association of eIF4A with the iNOS but not the MyoD mRNA. (g) Immunoprecipitations were done using an IgG or an antibody against eIF4A with extracts obtained from myofibres treated for 24 h with IFNγ/TNFα in the presence or absence of PatA. Western blots were then performed to detect eIF4A in the immunoprecipitated pellet. (h) The RNA associated with eIF4A was isolated and analysed by qRT–PCR. Relative levels of both messages associated with eIF4A in IFNγ/TNFα + PatA-treated myofibres are compared with the levels associated with eIF4A in IFNγ/TNFα treated myofibres. Results are presented from n=1 experiment.
Figure 8
Figure 8. Model depicting how PatA prevents cytokine-induced muscle wasting.
(a) The cytokines TNFα and IFNγ activate the expression of the iNOS enzyme, which in turn catalyzes NO production. NO then reacts with oxygen radicals, such as superoxide (O2), forming peroxynitrite, thereby triggering the loss of MyoD expression and muscle wasting. (b) PatA reverses this outcome by stabilizing and recruiting MyoD mRNA to translationally active polysomes. At the same time, PatA triggers the recruitment of the iNOS mRNA to SGs, blocking its translation. This prevents NO production and the loss of MyoD mRNA.

References

    1. Tisdale M. J. Mechanisms of cancer cachexia. Physiol. Rev. 89, 381–410 (2009). - PubMed
    1. Hall D. T., Ma J. F., Marco S. D. & Gallouzi I. E. Inducible nitric oxide synthase (iNOS) in muscle wasting syndrome, sarcopenia, and cachexia. Aging 3, 702–715 (2011). - PMC - PubMed
    1. Tisdale M. J. Loss of skeletal muscle in cancer: biochemical mechanisms. Front. Biosci. 6, D164–D174 (2001). - PubMed
    1. Pfitzenmaier J. et al. Elevation of cytokine levels in cachectic patients with prostate carcinoma. Cancer 97, 1211–1216 (2003). - PubMed
    1. Guttridge D. C., Mayo M. W., Madrid L. V., Wang C. Y. & Baldwin A. S. Jr. NF-kappaB-induced loss of MyoD messenger RNA: possible role in muscle decay and cachexia. Science 289, 2363–2366 (2000). - PubMed

Publication types