. 2012 Jun 12:3:902.
doi: 10.1038/ncomms1905.

Impaired thermogenesis and adipose tissue development in mice with fat-specific disruption of insulin and IGF-1 signalling

Affiliations

Impaired thermogenesis and adipose tissue development in mice with fat-specific disruption of insulin and IGF-1 signalling

Jeremie Boucher et al. Nat Commun. .

Abstract

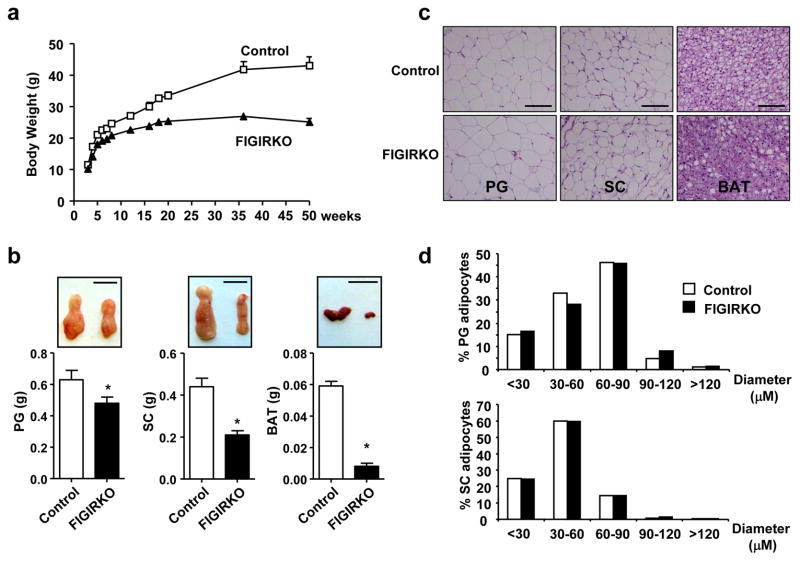
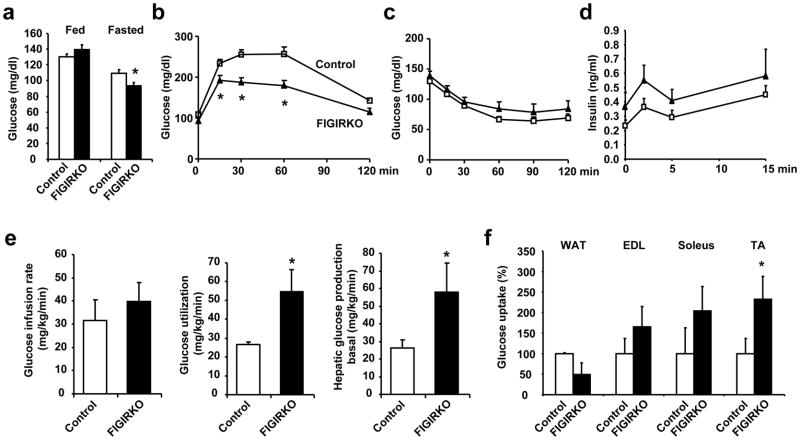
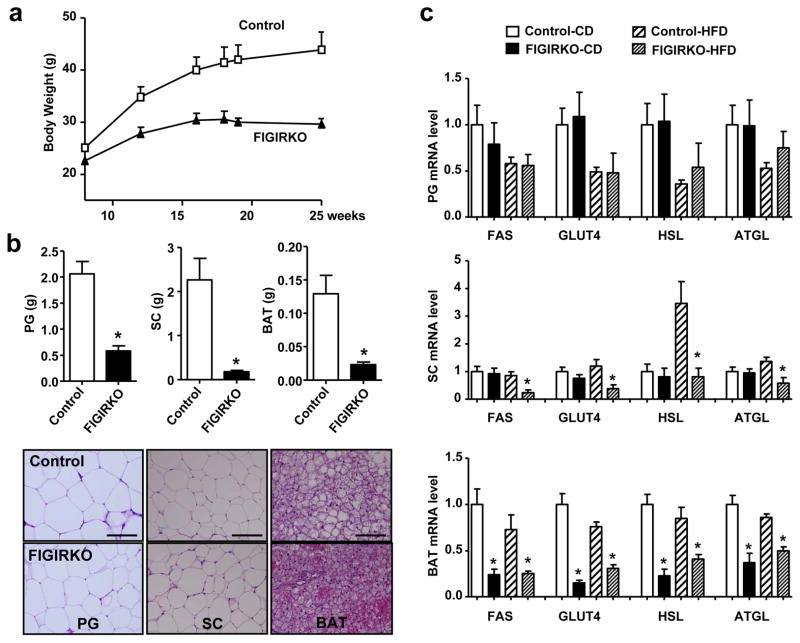
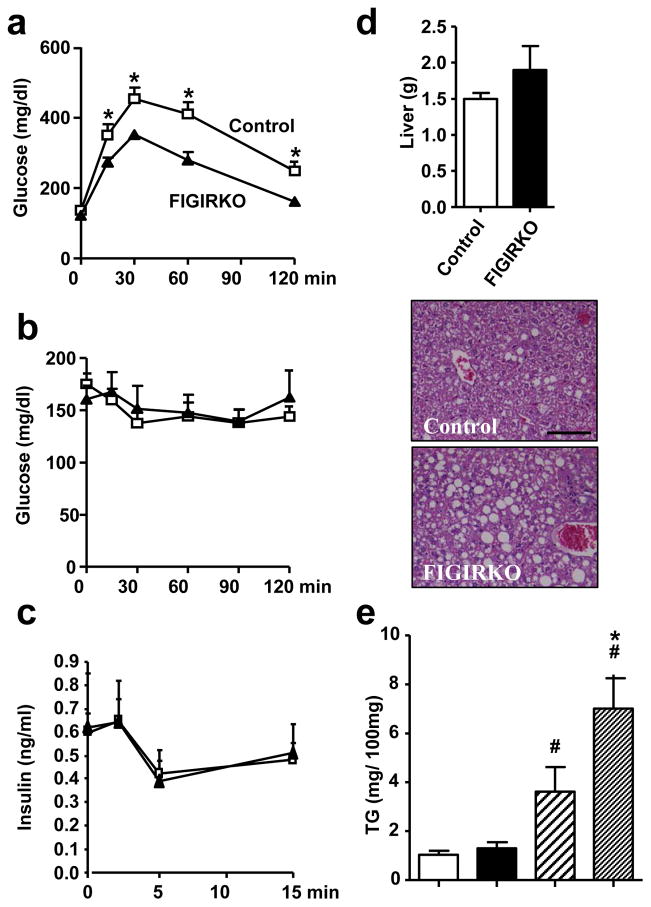
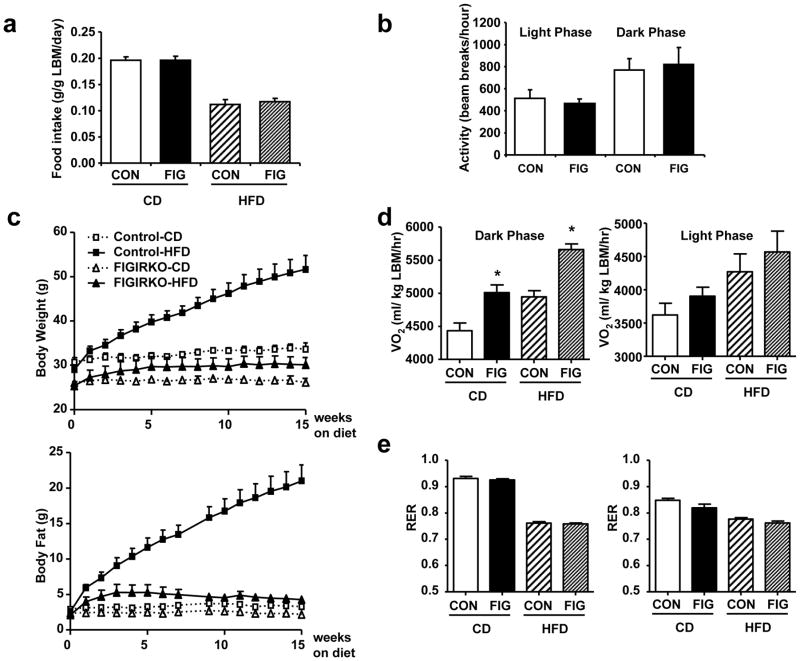
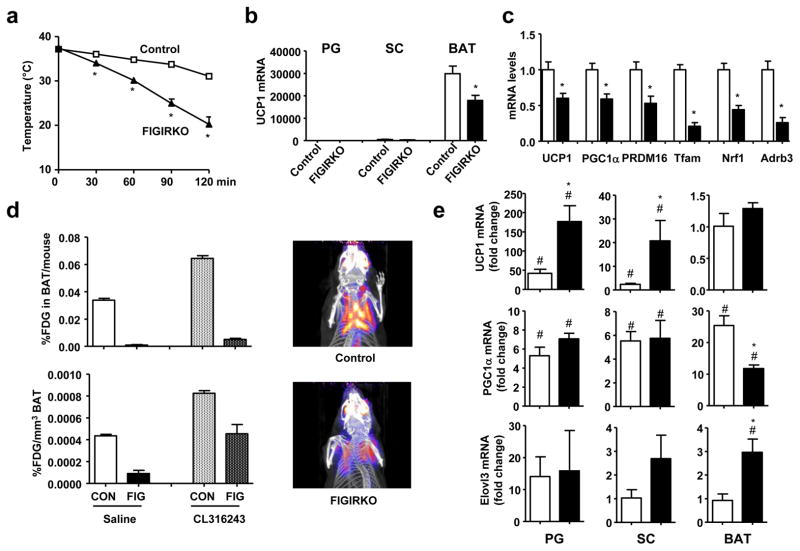
Insulin and insulin-like growth factor 1 (IGF-1) have important roles in adipocyte differentiation, glucose tolerance and insulin sensitivity. Here to assess how these pathways can compensate for each other, we created mice with a double tissue-specific knockout of insulin and IGF-1 receptors to eliminate all insulin/IGF-1 signalling in fat. These FIGIRKO mice had markedly decreased white and brown fat mass and were completely resistant to high fat diet-induced obesity and age- and high fat diet-induced glucose intolerance. Energy expenditure was increased in FIGIRKO mice despite a >85% reduction in brown fat mass. However, FIGIRKO mice were unable to maintain body temperature when placed at 4 °C. Brown fat activity was markedly decreased in FIGIRKO mice but was responsive to β3-receptor stimulation. Thus, insulin/IGF-1 signalling has a crucial role in the control of brown and white fat development, and, when disrupted, leads to defective thermogenesis and a paradoxical increase in basal metabolic rate.


Conflict of interest statement

COMPETING FINANCIAL INTERESTS STATEMENT

The research in this paper was supported entirely by NIH funding; however, Dr. Kahn is a founder and member of the Scientific Advisory Board of Ember Therapeutics, which is interested in adipose tissue as a target for therapy of diabetes and obesity

Figures

Figure 1
Figure 1. FIGIRKO mice have reduced adiposity
(a) Body weight of male control and FIGIRKO mice fed a chow diet. Results are mean ± SEM of 8–15 animals/group. (b) Lower panels show perigonadal (PG), inguinal subcutaneous (SC), and brown adipose tissue (BAT) depot weights in 4 months old control and FIGIRKO male mice fed a chow diet. Results are mean ± SEM of 16–18 animals/group. Upper panels show representative fat pads. Scale bar = 1 cm. (c) Hematoxylin and eosin stained sections of adipose tissues from male control and FIGIRKO at 4 months of age on a chow diet. Scale bar = 100μm. (d) Diameter distribution of isolated PG and SC adipocytes from 4 months old control and FIGIRKO male mice. Data represent the distribution from ≈4000 adipocytes from 4 control and 4 FIGIRKO mice. Statistical significance assessed by two-tailed Student’s t test, * p<0.05.
Figure 2
Figure 2. FIGIRKO mice are protected against age-associated glucose intolerance
(a) Fed and fasted blood glucose levels in 1 year old control and FIGIRKO male mice. Results are mean ± SEM of 7–8 animals/group. (b) Intraperitoneal glucose tolerance test and (c) Insulin tolerance test performed in 1 year old control and FIGIRKO male mice. Results are mean ± SEM of 7–8 animals/group. (d) First phase insulin secretion in 1 year old male control and FIGIRKO mice. Results are mean ± SEM of 12 animals/group. (e) Glucose infusion rate, glucose utilization, and hepatic glucose production in the basal state, were measured during an hyperinsulinemic-euglycemic clamp. Results are mean ± SEM of 4 control and 5 FIGIRKO mice. (f) Insulin-stimulated 14C-2-deoxyglucose uptake was assessed in perigonadal WAT, extensor digitorum longus (EDL), soleus and tibialis anterior (TA) skeletal muscles, during the final 45 minutes of the hyperinsulinemic-euglycemic clamp. Results are mean ± SEM of 4 control and 5 FIGIRKO mice. Statistical significance assessed by two-tailed Student’s t test, * p<0.05.
Figure 3
Figure 3. FIGIRKO mice display resistance to high fat diet induced obesity and glucose intolerance
(a) Body weight of control and FIGIRKO mice fed a HFD for 16 weeks. Results are mean ± SEM of 6 animals/group. (b) Adipose tissue weights (upper panel) and representative hematoxylin and eosin stained sections (lower panel) from perigonadal (PG), inguinal subcutaneous (SC), and brown adipose tissue (BAT) from 6 months old control and FIGIRKO male mice fed a HFD for 4 months. Results are mean ± SEM of 6 animals/group. Scale bar = 100 μm (c) Fas, Glut4, HSL and ATGL mRNA abundance was measured by real time PCR in perigonadal (PG), subcutaneous (SC), and brown (BAT) adipose tissues in male control and FIGIRKO mice fed either a chow diet (CD) or HFD. Results are mean ± SEM of 6 animals/group. Statistical significance assessed by two-tailed Student’s t test, * p<0.05.
Figure 4
Figure 4. FIGIRKO mice display resistance to high fat diet induced glucose intolerance
(a) Intraperitoneal glucose tolerance, (b) Insulin tolerance and (c) Glucose stimulated insulin secretion tests were performed in 6 months old control and FIGIRKO male mice fed a HFD for 4 months. Results are mean ± SEM of 6 animals/group. (d) Liver weight (upper panel) and representative hematoxylin and eosin stained section (lower panels) from 6 months old male control and FIGIRKO mice fed a HFD for 4 months. Results are mean ± SEM of 6 animals/group. Scale bar = 100μm. (e) Liver triglyceride content in 6 months old male control and FIGIRKO mice fed either a chow diet (CD) or a HFD. Statistical significance assessed by two-tailed Student’s t test, * p<0.05 between control and FIGIRKO mice, # p<0.05 between CD and HFD.
Figure 5
Figure 5. Increased energy expenditure in FIGIRKO mice
(a) Daily food intake was measured in chow diet (CD) or HFD fed control and FIGIRKO male mice. Mice were housed individually and food weight was measured 3 times a week for 2 consecutive weeks. For each mouse daily food intake was averaged and results are mean ± SEM of 6–8 animals/group. (b) Spontaneous activity was measured in control and FIGIRKO male mice fed a chow diet during 48 hours. Results are mean ± SEM of 12 animals/group. (c) Body weight and body fat content assessed by nuclear magnetic resonance were measured weekly in 6 months old control and FIGIRKO male mice fed a chow diet or high fat diet for another 4 months. Results are mean ± SEM of 6 animals/group. (d) Oxygen consumption (VO2) and (e) respiratory exchange ration (RER) were analyzed by indirect calorimetry in 10 months old control and FIGIRKO male mice fed a chow diet or a high fat diet for 4 months. Results are mean ± SEM of 6 animals/group. Statistical significance assessed by two-tailed Student’s t test, * p<0.05.
Figure 6
Figure 6. Adipocyte differentiation is impaired in DKO brown preadipocytes
(a) aP2, PPARγ, C/EBPα and C/EBPβ mRNA abundance was measured by real time PCR in BAT from control and FIGIRKO male mice fed either a chow or a high fat diet. Results are mean ± SEM of 6 animals/group. (b) Oil Red O staining of WT and DKO brown preadipocyte cells differentiated for 8 days in the presence or in the absence of the thiazolidinedione rosiglitasone (1 μM) or bone morphogenetic protein 7 (10 nM). A bright field microscopy picture of the differentiated cells is also shown. Scale bar = 100 μm (c) Protein levels measured by western blot in WT and DKO cells before or 2, 4 and 8 days after induction of the differentiation. One representative blot from 3 independent experiments is shown. (d) mRNA abundance was measured by real time PCR in WT and DKO cells during the differentiation process before or 2, 4 and 8 days after induction of the differentiation. Results are mean ± SEM of 4 independent experiments. (e) Protein levels measured by western blot in WT and DKO cells during the first 3 days of differentiation. One representative blot from 3 independent experiments is shown. (f) Phosphorylation of C/EBPβ on Thr188, and C/EBPβ and δ levels were measured in WT and DKO cells in cytoplasmic and nuclear extracts, both in basal conditions and 4 hours after the start of adipogenic conversion. One representative blot from 3 independent experiments is shown. Statistical significance assessed by two-tailed Student’s t test, * p<0.05.
Figure 7
Figure 7. FIGIRKO mice are extremely cold sensitive
(a) Rectal temperature was measured in 4 months old control and FIGIRKO male mice every 30 min for 2 hours after exposure to a 4°C environment (n=9 per group). (b) UCP1 mRNA abundance was measured by real-time PCR in PG, SC and BAT in 4 months old male control and FIGIRKO mice. (c) mRNA abundance was measured by real-time PCR in BAT from 4 month old control and FIGIRKO male mice. Results are mean ± SEM of 6 animals/group. (d) Control and FIGIRKO mice were anesthetized and injected with 18-FDG. One hour after FDG injection, whole body PET-CT scans were performed and the interscapular area was analyzed to measure FDG uptake in BAT. The experiment was repeated 1 hour after injection of CL316243 (1 μg/g body weight) intraperitoneally. Results are mean ± SEM of 2 animals/group. Right panel show three-dimensional reconstruction images of control and FIGIRKO mice after FDG injection in the basal state. (e) UCP1, PGC1α and Elovl3 mRNA abundance was measured by real time PCR in PG, SC and BAT in 4 months old control and FIGIRKO male mice injected with either saline or CL316243 (1μg/g body weight) intraperitoneally. Results are mean ± SEM of 5 animals/group and are expressed as fold change over the saline group. Statistical significance assessed by two-tailed Student’s t test, * p<0.05 between control and FIGIRKO mice, # p<0.05 between saline and CL316243 treated group.

References

    1. Haslam DW, James WP. Obesity. Lancet. 2005;366:1197–1209. - PubMed
    1. Cypess AM, et al. Identification and importance of brown adipose tissue in adult humans. N Engl J Med. 2009;360:1509–1517. - PMC - PubMed
    1. Marken Lichtenbelt WD, et al. Cold-activated brown adipose tissue in healthy men. N Engl J Med. 2009;360:1500–1508. - PubMed
    1. Saito M, et al. High incidence of metabolically active brown adipose tissue in healthy adult humans: effects of cold exposure and adiposity. Diabetes. 2009;58:1526–1531. - PMC - PubMed
    1. Virtanen KA, et al. Functional brown adipose tissue in healthy adults. N Engl J Med. 2009;360:1518–1525. - PubMed

Publication types