. 2012 Aug;31(8):1620-7.
doi: 10.1109/TMI.2012.2201165. Epub 2012 Jun 5.

Investigation of X-ray fluorescence computed tomography (XFCT) and K-edge imaging

Affiliations

Investigation of X-ray fluorescence computed tomography (XFCT) and K-edge imaging

Magdalena Bazalova et al. IEEE Trans Med Imaging. 2012 Aug.

Abstract

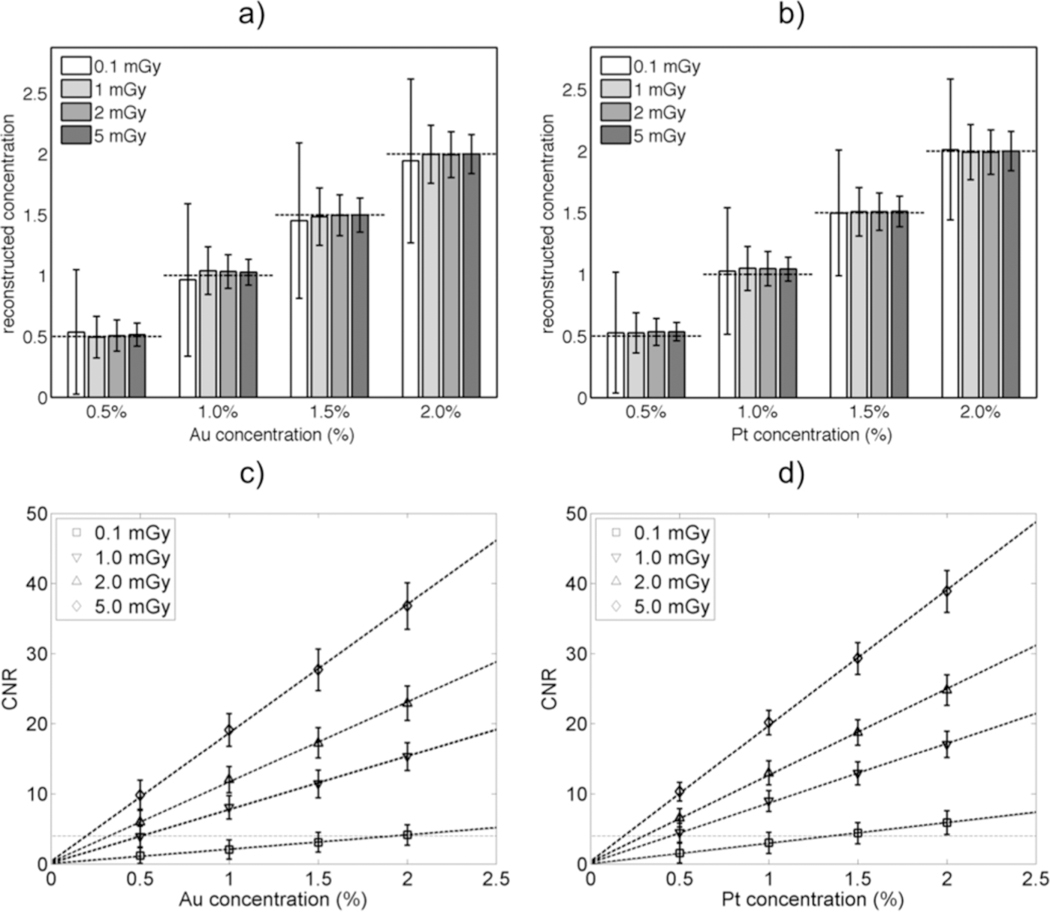
This work provides a comprehensive Monte Carlo study of X-ray fluorescence computed tomography (XFCT) and K-edge imaging system, including the system design, the influence of various imaging components, the sensitivity and resolution under various conditions. We modified the widely used EGSnrc/DOSXYZnrc code to simulate XFCT images of two acrylic phantoms loaded with various concentrations of gold nanoparticles and Cisplatin for a number of XFCT geometries. In particular, reconstructed signal as a function of the width of the detector ring, its angular coverage and energy resolution were studied. We found that XFCT imaging sensitivity of the modeled systems consisting of a conventional X-ray tube and a full 2-cm-wide energy-resolving detector ring was 0.061% and 0.042% for gold nanoparticles and Cisplatin, respectively, for a dose of ∼ 10 cGy. Contrast-to-noise ratio (CNR) of XFCT images of the simulated acrylic phantoms was higher than that of transmission K-edge images for contrast concentrations below 0.4%.


Figures

Fig. 1.
Fig. 1.
Simulation setup of X-ray fluorescence and transmission CT imaging. The X-ray source was a 110 kV photon beam (spectrum shown on the right). Examples XFCT and transmission CT images are also presented.
Fig. 2.
Fig. 2.
Schematic drawings of the simulated phantoms. Low-resolution phantom (a) is a 5-cm-diameter acrylic cylinder containing four 1-cm-diameter cylindrical vials with contrast media with concentrations of 0.5%, 1.0%, 1.5%, and 2.0%. Phantom (b) is a high-resolution high-concentration phantom containing vials with diameters of 0.5, 0.4, 0.3, 0.2, 0.15 cm and contrast media with concentrations from 0.5% to 2.0%. Phantom (c) is a high-resolution low-concentration phantom with concentrations ranging from to 0.1%–0.4%.
Fig.3.
Fig.3.
Imaging dose for the (a)low-resolution and(b)high-resolution phantom loaded with gold nanoparticles. The dose to the center of the phantoms is 2 mGy.
Fig. 4.
Fig. 4.
Energy spectrum for a single sinogram point of the low-resolution phantom loaded with gold (a) and platinum (b) imaged with 0.1 mGy.
Fig. 5.
Fig. 5.
inograms (top) and reconstructed CT images (bottom) for XFCT (left) and transmission CT (right) of the low-resolution phantom loaded with gold for a 0.1 mGy imaging dose.
Fig. 6.
Fig. 6.
XFCT images of the low-resolution phantom loaded with gold (top) and platinum (bottom) as a function of imaging dose. Values from 0 to the maximum reconstructed value are displayed in each XFCT image.
Fig. 7.
Fig. 7.
Reconstructed concentration (a, b) and CNR (c, d) as a function of contrast concentration and imaging dose for gold (a, c) and platinum (b, d) based on simulations of the low-resolution phantom.
Fig. 8.
Fig. 8.
CNR for four concentrations of platinum as a function of detector width (a), detector angular coverage (b), and detector energy resolution (c) based on the low-resolution phantom imaged with a 2 mGy dose.
Fig. 9.
Fig. 9.
Reconstructed images of the high-resolution phantom loaded with gold (top) and platinum (bottom). XFCT images (first column), transmission CT image generated using all X-rays(second column) and using X-rays below (third column) the respective Kedge, K-edge CT images (fourth column) are reconstructed by subtracting C<Kedge images form CT images. Transmission image W/L settings are 1000 and 0 and the full range of reconstructed values is displayed in contrast-only images.
Fig. 10.
Fig. 10.
CNR calculated from XFCT and K-edge CT images for various concentrations of gold and platinum as a function of contrast agent concentration and object size. Imaging dose is 2 mGy.
Fig. 11.
Fig. 11.
CNR calculated from XFCT and K-edge CT images for various concentrations of gold and platinum as a function of contrast agent concentration and object size for concentration of 0.1%–0.4%. Imaging dose is 2 mGy.
Fig. 12.
Fig. 12.
The schematic of the bone phantom (a), its CT (b), XFCT (c), and K-edge CT (d) images.

References

    1. Cong W, Shen H, and Wang G, “Spectrally resolving and scattering-compensated X-ray luminescence/fluorescence computed tomography,” J. Biomed. Opt, vol. 16, no. 6, pp. 066014–1–066014–7, Jun. 2011. - PMC - PubMed
    1. Pratx G. et al., “Tomographic molecular imaging of X-ray-excitable nanoparticles,” Opt. Lett, vol. 35, no. 20, pp. 3345–3347, Oct. 2010. - PMC - PubMed
    1. Pratx G. et al., “X-ray luminescence computed tomography via selective excitation: A feasibility study,” IEEE Trans. Med. Imag, vol. 29, no. 12, pp. 1992–1999, Dec. 2010. - PMC - PubMed
    1. Jones BL and Cho SH, “The feasibility of polychromatic cone-beam X-ray fluorescence computed tomography (XFCT) imaging of gold nanoparticle-loaded objects: A Monte Carlo study,” Phys. Med. Biol, vol. 56, no. 12, pp. 3719–3730, Jun. 2011. - PubMed
    1. Cheong S-K et al., “X-ray fluorescence computed tomography (XFCT) imaging of gold nanoparticle-loaded objects using 110 kVp X-rays,” Phys. Med. Biol, vol. 55, no. 3, pp. 647–662, Feb. 2010. - PubMed

Publication types

MeSH terms