

4-T 7Li 3D MR spectroscopy imaging in the brains of bipolar disorder subjects
- PMID: 22692991
- PMCID: PMC3396736
- DOI: 10.1002/mrm.24361
4-T 7Li 3D MR spectroscopy imaging in the brains of bipolar disorder subjects
Abstract
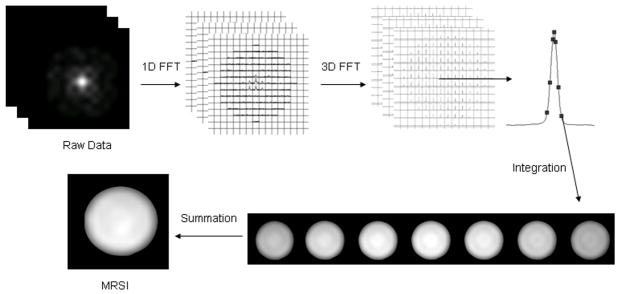
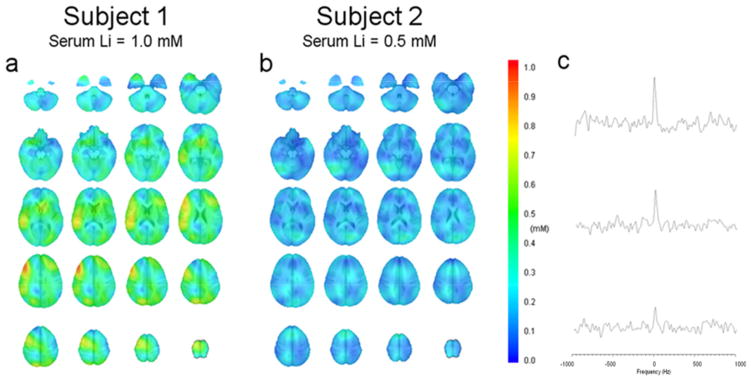
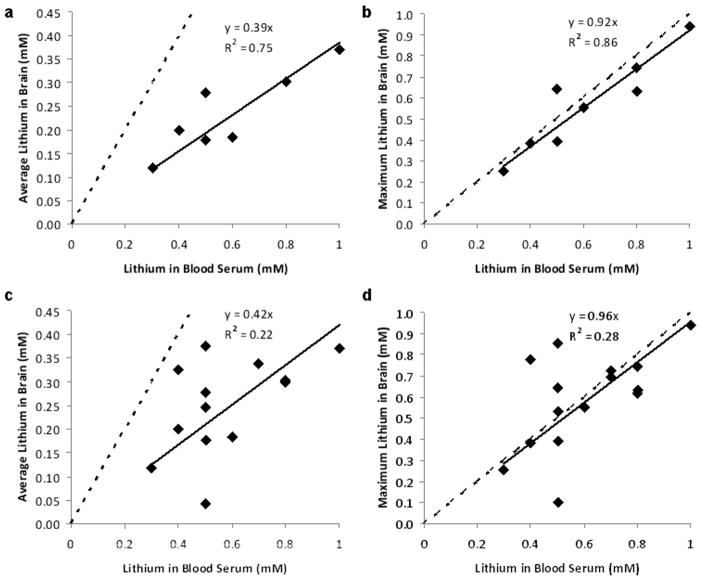
This work demonstrates the first whole brain "high spatial resolution" (7)Li MR spectroscopy imaging in bipolar disorder subjects. The in vivo quantification is validated by a phantom containing 5 mM lithium salt using the identical radiofrequency sequence and imaging protocol. This study is the first demonstration of the (7)Li distribution in the brain of bipolar disorder patients on lithium therapy using a 3D MR spectroscopy imaging approach. The results show that brain lithium level is strongly correlated with serum lithium concentration. The brain-to-serum lithium ratios for the average brain and the local maximum were 0.39 ± 0.08 (r = 0.93) and 0.92 ± 0.16 (r = 0.90), respectively. The lithium distribution is found to be nonuniform throughout the brain for all patients, which is somewhat unexpected and highly intriguing. This uneven distribution is more evident in subjects at a higher therapeutic serum lithium level. This finding may suggest that lithium targets specific brain tissues and/or certain enzymatic and macromolecular sites that are associated with therapeutic effect. Further investigations of bipolar disorder patients on lithium therapy using 3D (7)Li MR spectroscopy imaging are warranted.
Copyright © 2012 Wiley Periodicals, Inc.
Figures

References
-
- Renshaw PF, Sachs GS, Gonzalez RG. In vivo MRS measurement of lithium levels in brain. In: Nasrallah HA, Pettegrew JW, editors. NMR Spectroscopy in Psychiatric Brain Disorders. Vol. 8. American Psychiatric Press; Washington: 1995. pp. 179–198.
-
- Ikeda A, Kato T. Biological predictors of lithium response in bipolar disorder. Psychiatry Clin Neurosci. 2003;57:243–250. - PubMed
-
- Soares JC, Boada F, Keshavan MS. Brain lithium measurements with 7Li magnetic resonance spectroscopy (MRS): A literature review. European Neuropsychopharmacol. 2000;10:151–158. - PubMed
-
- Komoroski RA. Applications of 7Li NMR in biomedicine. Magn Reson Imaging. 2000;18:103–116. - PubMed
-
- Komoroski RA. Biomedical applications of 7Li NMR. NMR Biomed. 2005;18:67–73. - PubMed
