. 2012 Jul;81(7):552-66.
doi: 10.1002/cyto.a.22075. Epub 2012 Jun 12.

Single-cell mass cytometry adapted to measurements of the cell cycle

Affiliations

Single-cell mass cytometry adapted to measurements of the cell cycle

Gregory K Behbehani et al. Cytometry A. 2012 Jul.

Abstract

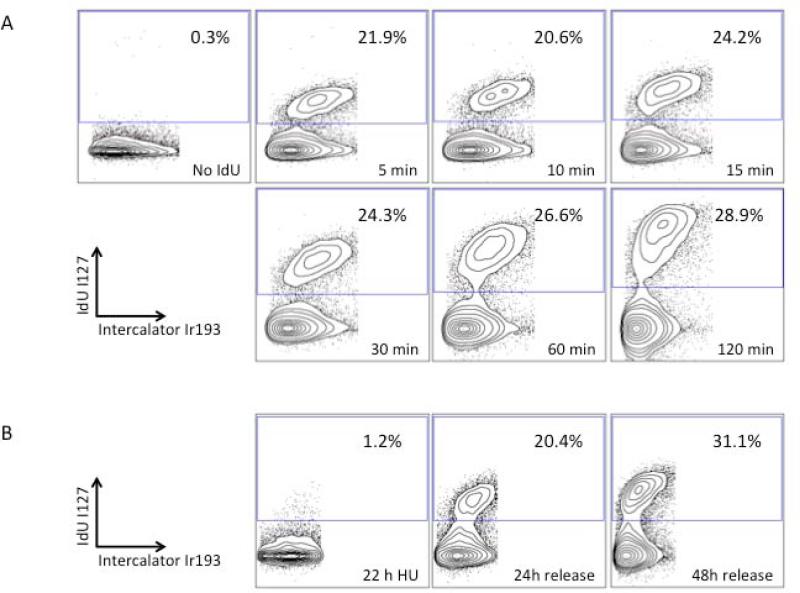
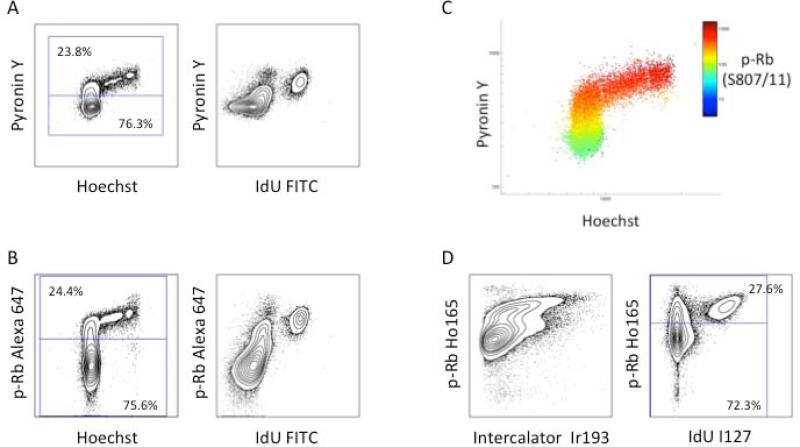
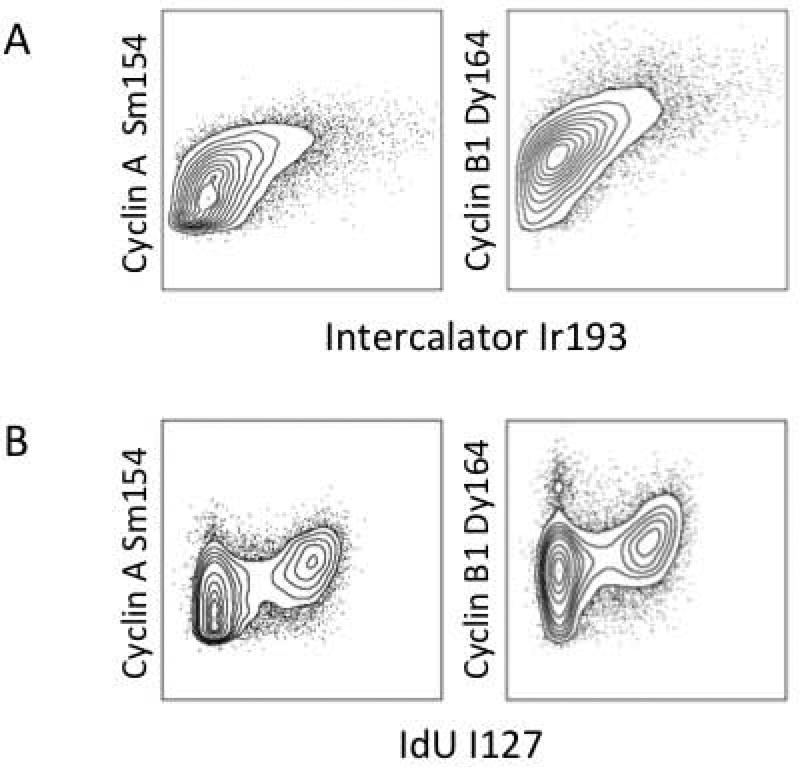
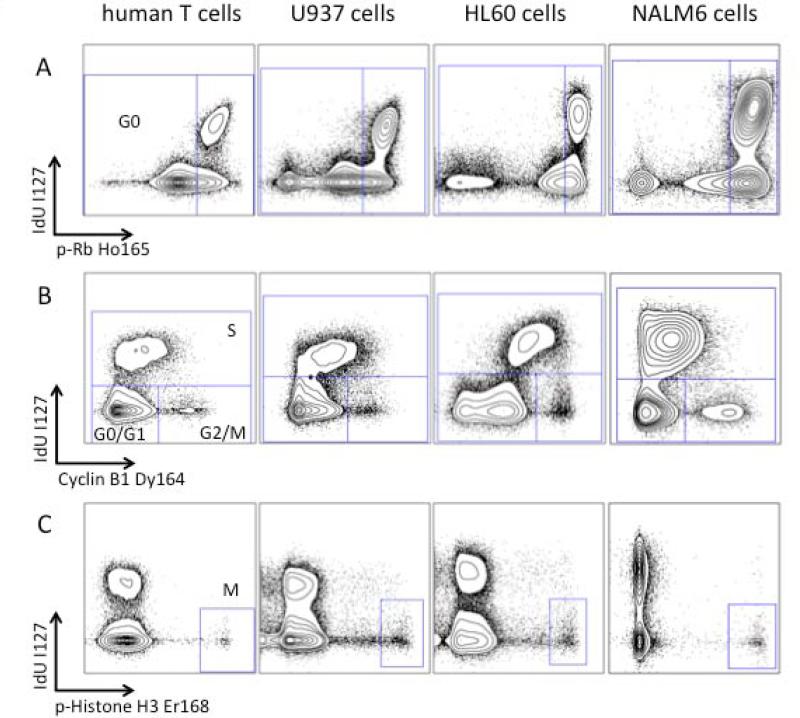
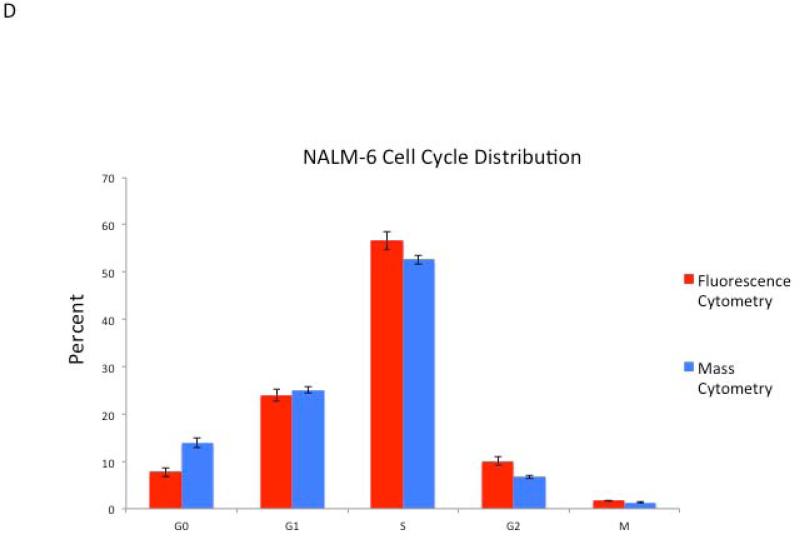
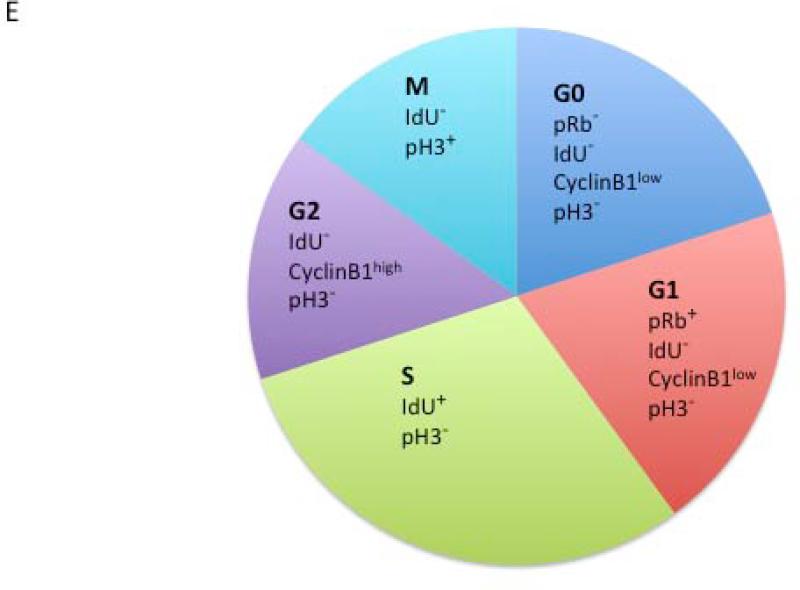
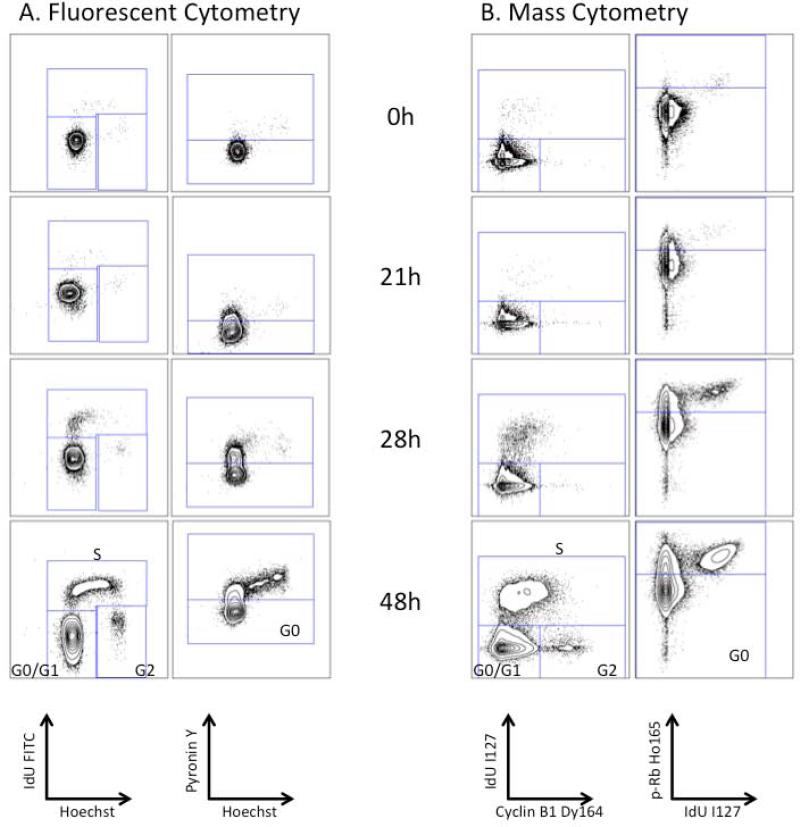
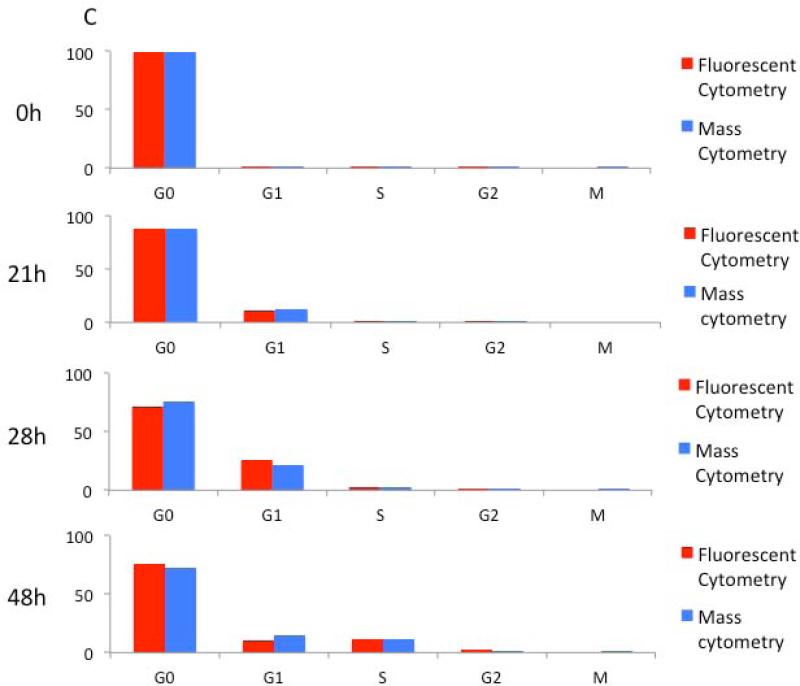
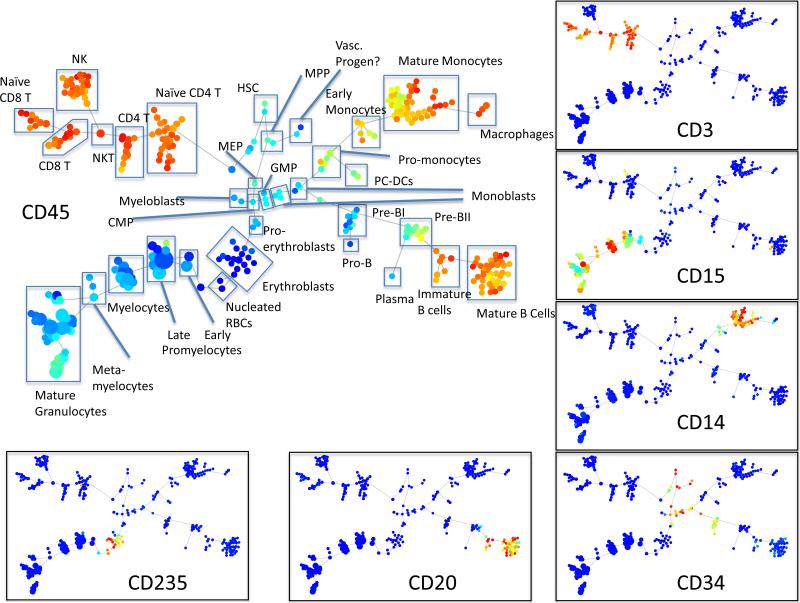
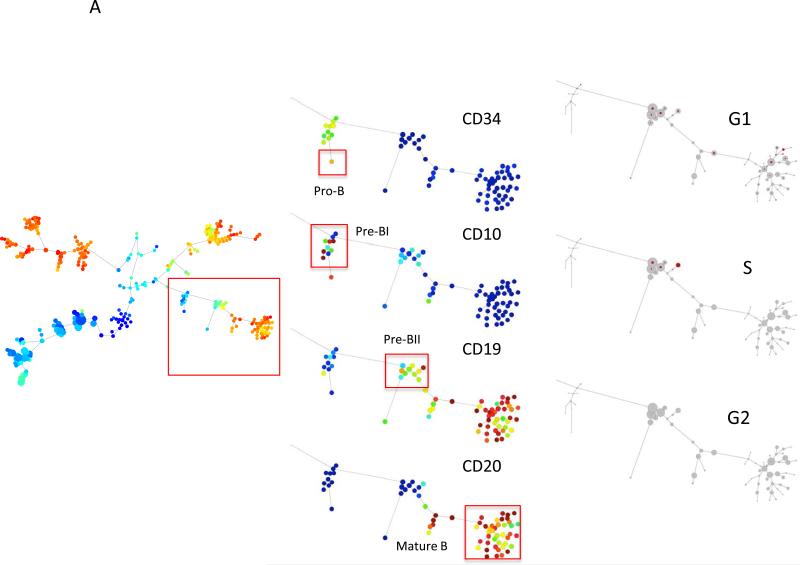
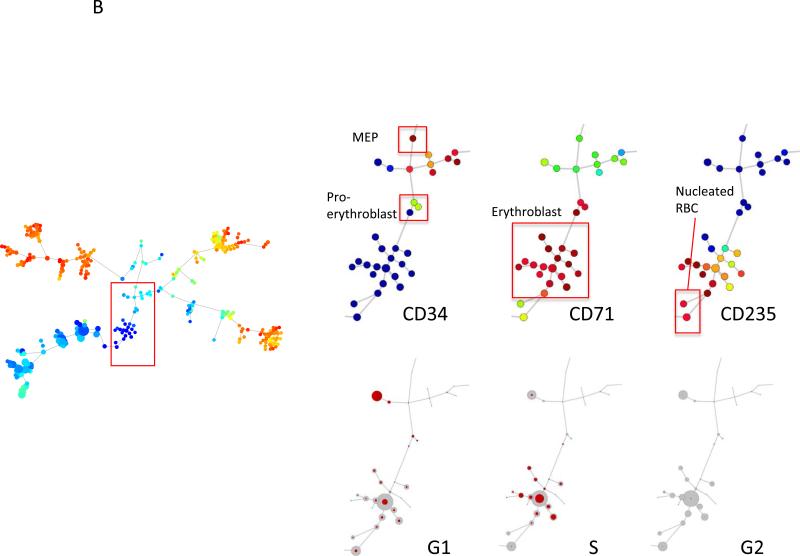
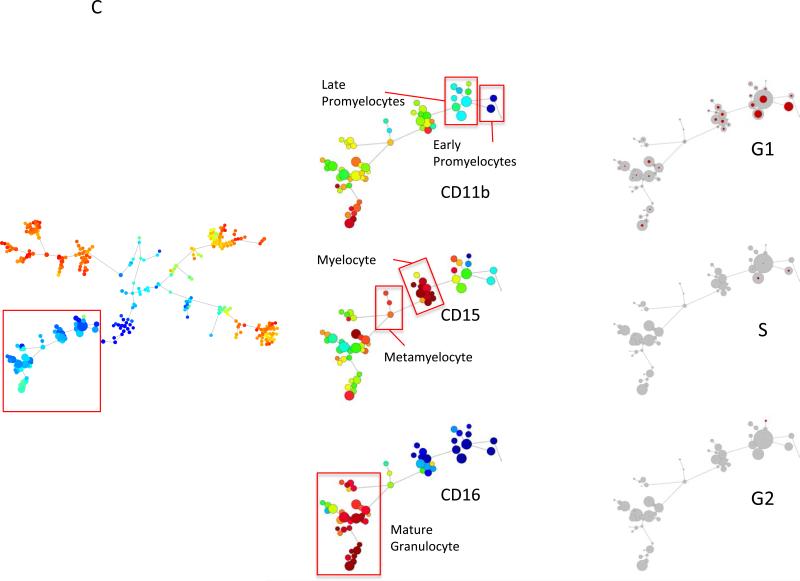
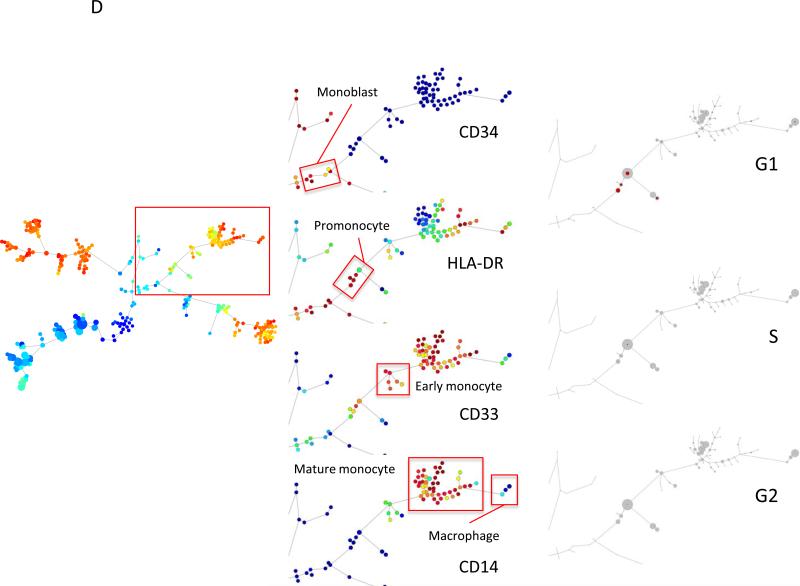
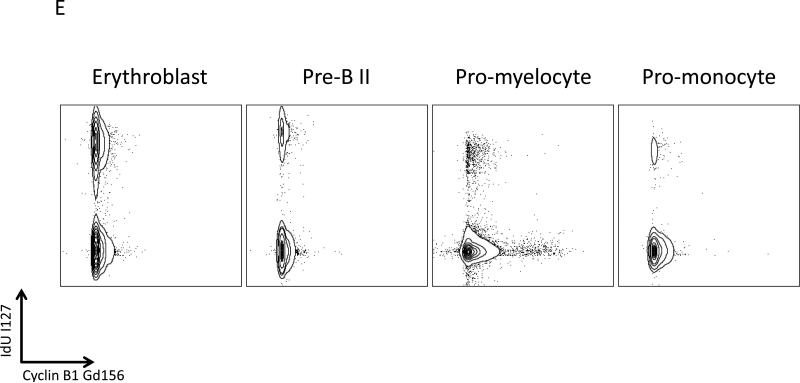
Mass cytometry is a recently introduced technology that utilizes transition element isotope-tagged antibodies for protein detection on a single-cell basis. By circumventing the limitations of emission spectral overlap associated with fluorochromes utilized in traditional flow cytometry, mass cytometry currently allows measurement of up to 40 parameters per cell. Recently, a comprehensive mass cytometry analysis was described for the hematopoietic differentiation program in human bone marrow from a healthy donor. The current study describes approaches to delineate cell cycle stages utilizing 5-iodo-2-deoxyuridine (IdU) to mark cells in S phase, simultaneously with antibodies against cyclin B1, cyclin A, and phosphorylated histone H3 (S28) that characterize the other cell cycle phases. Protocols were developed in which an antibody against phosphorylated retinoblastoma protein (Rb) at serines 807 and 811 was used to separate cells in G0 and G1 phases of the cell cycle. This mass cytometry method yielded cell cycle distributions of both normal and cancer cell populations that were equivalent to those obtained by traditional fluorescence cytometry techniques. We applied this to map the cell cycle phases of cells spanning the hematopoietic hierarchy in healthy human bone marrow as a prelude to later studies with cancers and other disorders of this lineage.


Figures

Figure 1
Figure 1
Mass cytometric measurement of IdU incorporation specifically identifies S phase cells. (A) U937 cells were incubated with 10 μM IdU for the indicated times, fixed, and analyzed by mass cytometry; S-phase gate is indicated. Cells not incubated with IdU have no significant iodine signal. (B) Treatment with 1.5 μM hydroxyurea for 22 hours blocked IdU incorporation; IdU incorporation was restored 24 hours after release from the hydroxyurea block.
Figure 2
Figure 2
Measurement of phosphorylated Rb on serines 807 and 811 discriminates of G0 from G1 cells by both fluorescent cytometry and mass cytometry. (A) Identification of G0 and G1 cells in stimulated T cells using Hoechst 3342 and pyronin Y staining (left) and pyronin Y staining vs. antibody detection of IdU incorporation (right). (B) The p-Rb(S807/811) staining pattern is similar to that of pyronin Y and defines similar G0 and G1 populations. (C) A plot of Hoechst 3342 vs. pyronin Y colored for staining by p-Rb(S807/811), Alexa 647. (D) Analysis of the same cell sample by mass cytometry using p-Rb(S807/811) labeled on Ho165 vs. iridium intercalator (left) or IdU incorporation (right).
Figure 3
Figure 3
Total cyclin levels can be detected by mass cytometry and used to sub-divide the cell cycle. cyclin A, and cyclin B1 were measured relative to Iridium intercalator (A) or IdU incorporation (B).
Figure 4
Figure 4
Cell cycle analysis by mass cytometry yields results equivalent to fluorescence cytometry methods. (A) A plot of IdU vs. p-Rb(S807/811) allows for gating of G0 and G1 phase populations. (B) A plot of IdU incorporation vs. cyclin B1 allows gating of G1, S, and G2/M populations as shown. (C) p-HH3(S28) defines an M-phase population. (D) Percentage of NALM-6 cells in each cell cycle phase as measured by mass and fluorescence (Hoechst-pyronin Y) cytometry. Six separate aliquots were taken from a single culture and individually treated with IdU and prepared for mass or fluorescence cytometry analysis. Standard deviation is shown by error bars. (E) Diagram of cell cycle gating strategy for each phase of the cell cycle. Cell events must fall within each of the indicated gates to be assigned to a given cell cycle state.
Figure 4
Figure 4
Cell cycle analysis by mass cytometry yields results equivalent to fluorescence cytometry methods. (A) A plot of IdU vs. p-Rb(S807/811) allows for gating of G0 and G1 phase populations. (B) A plot of IdU incorporation vs. cyclin B1 allows gating of G1, S, and G2/M populations as shown. (C) p-HH3(S28) defines an M-phase population. (D) Percentage of NALM-6 cells in each cell cycle phase as measured by mass and fluorescence (Hoechst-pyronin Y) cytometry. Six separate aliquots were taken from a single culture and individually treated with IdU and prepared for mass or fluorescence cytometry analysis. Standard deviation is shown by error bars. (E) Diagram of cell cycle gating strategy for each phase of the cell cycle. Cell events must fall within each of the indicated gates to be assigned to a given cell cycle state.
Figure 5
Figure 5
Validation of mass cytometric cell cycle measurement during stimulation of human peripheral blood T cells by PMA and ionomycin. (A) Fluorescent cytometry cell cycle assessment. Left, measurement of cells in G0/G1, S, and G2/M using Hoechst and anti-IdU antibody (detected by FITC secondary antibody) at indicated timepoints following PMA and ionomycin stimulation. Right, discrimination of G0 and G1 cells using Hoechst and pyronin Y. (B) Mass cytometry cell cycle assessment. Left, measurement of cells in G0/G1, S, and G2/M using cyclin B and direct IdU measurement at indicated timepoints following stimulation. Right, discrimination of G0 and G1 cells using p-Rb(S807/811) and IdU detection. (C) Comparison of the fraction of cells measured in each phase of the cell cycle by fluorescent cytometry and mass cytometry. All cell events have been gated on viable T cells (FSC vs. SSC, DNA≥2n, CD3+ for fluorescent analysis; DNA vs. cell length, cleaved PARP-, CD3+ for mass cytometry).
Figure 5
Figure 5
Validation of mass cytometric cell cycle measurement during stimulation of human peripheral blood T cells by PMA and ionomycin. (A) Fluorescent cytometry cell cycle assessment. Left, measurement of cells in G0/G1, S, and G2/M using Hoechst and anti-IdU antibody (detected by FITC secondary antibody) at indicated timepoints following PMA and ionomycin stimulation. Right, discrimination of G0 and G1 cells using Hoechst and pyronin Y. (B) Mass cytometry cell cycle assessment. Left, measurement of cells in G0/G1, S, and G2/M using cyclin B and direct IdU measurement at indicated timepoints following stimulation. Right, discrimination of G0 and G1 cells using p-Rb(S807/811) and IdU detection. (C) Comparison of the fraction of cells measured in each phase of the cell cycle by fluorescent cytometry and mass cytometry. All cell events have been gated on viable T cells (FSC vs. SSC, DNA≥2n, CD3+ for fluorescent analysis; DNA vs. cell length, cleaved PARP-, CD3+ for mass cytometry).
Figure 6
Figure 6
Immunophenotypic analysis of healthy human bone marrow. A minimum spanning tree was constructed using SPADE analysis based on 25 cell surface markers. The size of each circle in the tree approximates the relative frequency of cells that fall within boundaries of surface marker expression that define each node. Node color is scaled to the median intensity of expression of the indicated markers. Putative cell populations were annotated manually based on previous studies. Eight of the SPADE tree clusters could not be definitively identified on the basis of the surface markers present in this antibody panel. (Minimum and maximum node size was constrained to allow visualization of marker intensity.)
Figure 7
Figure 7
Mass cytometric measurement of the cell cycle distribution across normal human hematopoiesis. (A) Cell cycle distribution across B cell development. Left, “branch” of B cell development from hematopoietic tree shown in Figure 6. Center, population annotations and expression levels of population defining surface markers for the B cell “branch” (node color and node sizing scaling as described in Figure 6). Right, distribution of cells in each phase of the cell cycle in the B cell “branch” of the tree. The number of cells within each node is indicated by the size of the gray circle, while the number of cells in the labeled cell cycle phase is indicated by the size of the red circle. In the left column, the size of each circle is directly correlated with the number of cells within each node and there is no maximum or minimum size constraint. The red circle size is scaled such that a completely filled circle represents 67% of cells within the node in the indicated cell cycle phase. (B) Cell cycle distribution across erythroid development. Left, “branch” of erythroid development from hematopoietic tree shown i n Figure 6. Center, population annotations and expression levels of population defining surface markers for the erythroid “branch” (node color and node sizing scaling as described in Figure 6). Right, distribution of cells in each phase of the cell cycle in the erythroid “branch” of the tree. Node sizing as described in (A). (C) Cell cycle distribution across myeloid development. Left, “branch” of myeloid development from hematopoietic tree shown in Figure 6. Center, population annotations and expression levels of population defining surface markers for the myeloid “branch” (node color and node sizing scaling as described in Figure 6). Right, distribution of cells in each phase of the cell cycle in the myeloid “branch” of the tree. Node sizing as described in (A). (D) Cell cycle distribution across monocyte development. Left, “branch” of monocyte development from hematopoietic tree shown in Figure 6. Center, population annotations and expression levels of population defining surface markers for the monocyte “branch” (node color and node sizing scaling as described in Figure 6). Right, distribution of cells in each phase of the cell cycle in the monocyte “branch” of the tree. Node sizing as described in (A). (E) The amount of IdU incorporation varies across S phase cells of different developmental lineages. IdU signal versus cyclin B1 signal in the indicated cell subpopulations (as described in Figure 6).
Figure 7
Figure 7
Mass cytometric measurement of the cell cycle distribution across normal human hematopoiesis. (A) Cell cycle distribution across B cell development. Left, “branch” of B cell development from hematopoietic tree shown in Figure 6. Center, population annotations and expression levels of population defining surface markers for the B cell “branch” (node color and node sizing scaling as described in Figure 6). Right, distribution of cells in each phase of the cell cycle in the B cell “branch” of the tree. The number of cells within each node is indicated by the size of the gray circle, while the number of cells in the labeled cell cycle phase is indicated by the size of the red circle. In the left column, the size of each circle is directly correlated with the number of cells within each node and there is no maximum or minimum size constraint. The red circle size is scaled such that a completely filled circle represents 67% of cells within the node in the indicated cell cycle phase. (B) Cell cycle distribution across erythroid development. Left, “branch” of erythroid development from hematopoietic tree shown i n Figure 6. Center, population annotations and expression levels of population defining surface markers for the erythroid “branch” (node color and node sizing scaling as described in Figure 6). Right, distribution of cells in each phase of the cell cycle in the erythroid “branch” of the tree. Node sizing as described in (A). (C) Cell cycle distribution across myeloid development. Left, “branch” of myeloid development from hematopoietic tree shown in Figure 6. Center, population annotations and expression levels of population defining surface markers for the myeloid “branch” (node color and node sizing scaling as described in Figure 6). Right, distribution of cells in each phase of the cell cycle in the myeloid “branch” of the tree. Node sizing as described in (A). (D) Cell cycle distribution across monocyte development. Left, “branch” of monocyte development from hematopoietic tree shown in Figure 6. Center, population annotations and expression levels of population defining surface markers for the monocyte “branch” (node color and node sizing scaling as described in Figure 6). Right, distribution of cells in each phase of the cell cycle in the monocyte “branch” of the tree. Node sizing as described in (A). (E) The amount of IdU incorporation varies across S phase cells of different developmental lineages. IdU signal versus cyclin B1 signal in the indicated cell subpopulations (as described in Figure 6).

Comment in

Similar articles

Cited by

References

    1. Ornatsky O, Baranov VI, Bandura DR, Tanner SD, Dick J. Multiple cellular antigen detection by ICP-MS. J Immunol Methods. 2006 Jan 20;308:68. - PubMed
    1. Ornatsky OI, et al. Development of analytical methods for multiplex bioassay with inductively coupled plasma mass spectrometry. J Anal At Spectrom. 2008;23:463. - PMC - PubMed
    1. Bandura DR, et al. Mass cytometry: technique for real time single cell multitarget immunoassay based on inductively coupled plasma time-of-flight mass spectrometry. Anal Chem. 2009 Aug 15;81:6813. - PubMed
    1. Bendall SC, et al. Single-cell mass cytometry of differential immune and drug responses across a human hematopoietic continuum. Science. 2011 May 6;332:687. - PMC - PubMed
    1. Qiu P, et al. Extracting a cellular hierarchy from high-dimensional cytometry data with SPADE. Nat Biotech. 2011;29:886. - PMC - PubMed

Publication types

MeSH terms

LinkOut - more resources