. 2012 May;8(5):e1002533.
doi: 10.1371/journal.pcbi.1002533. Epub 2012 May 31.

Quality of computationally inferred gene ontology annotations

Affiliations

Quality of computationally inferred gene ontology annotations

Nives Skunca et al. PLoS Comput Biol. 2012 May.

Abstract

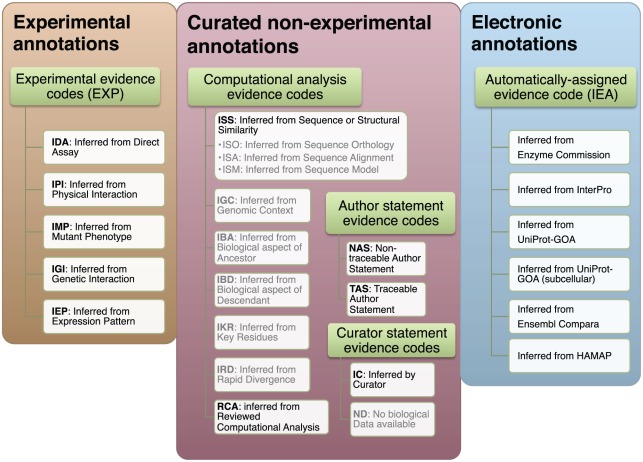
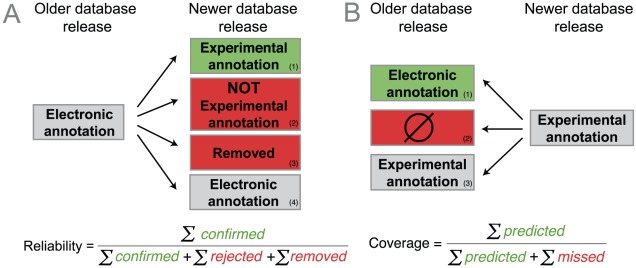
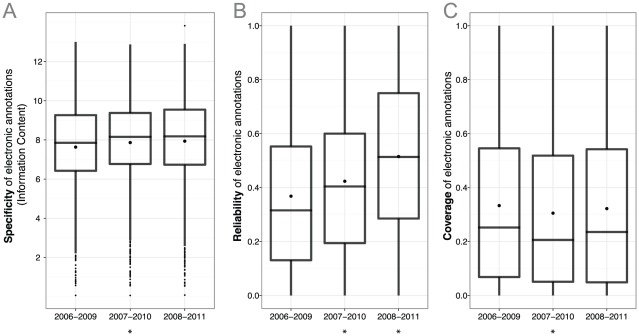
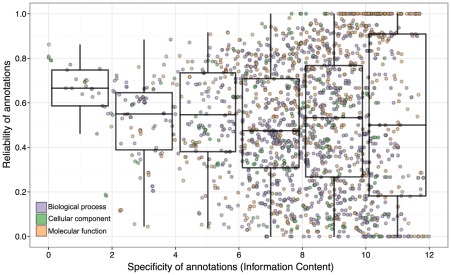
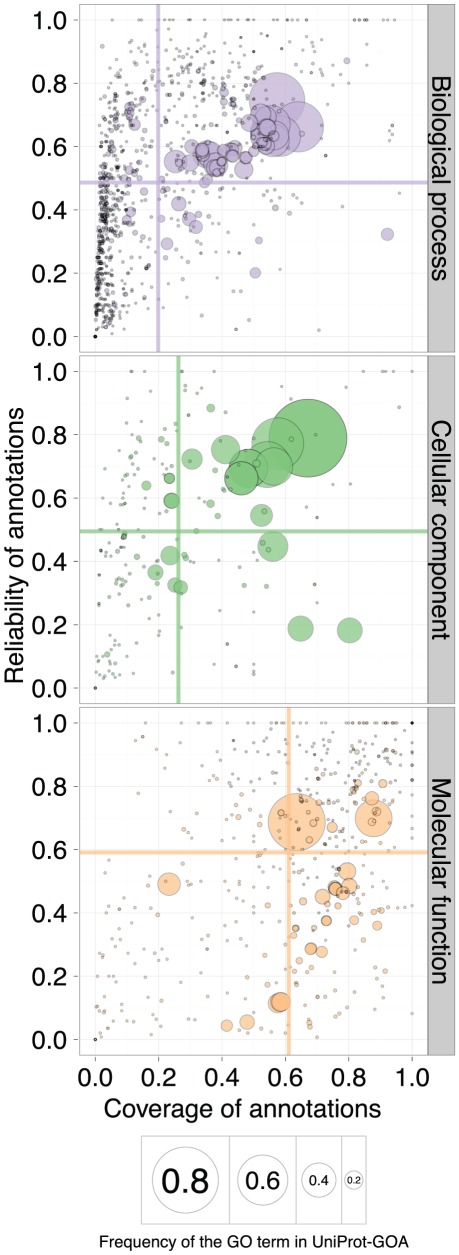
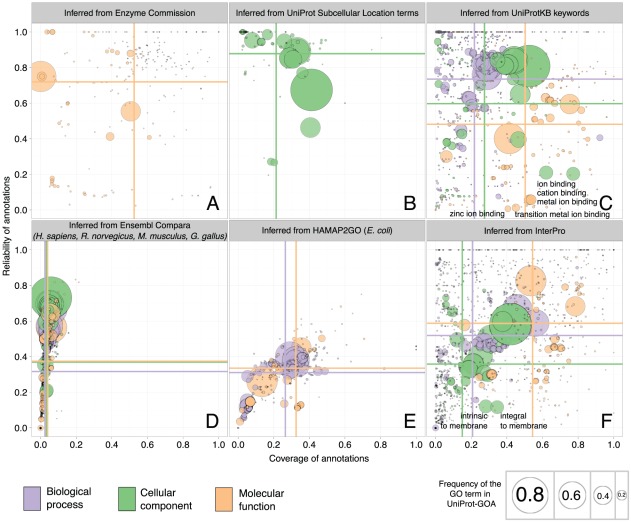
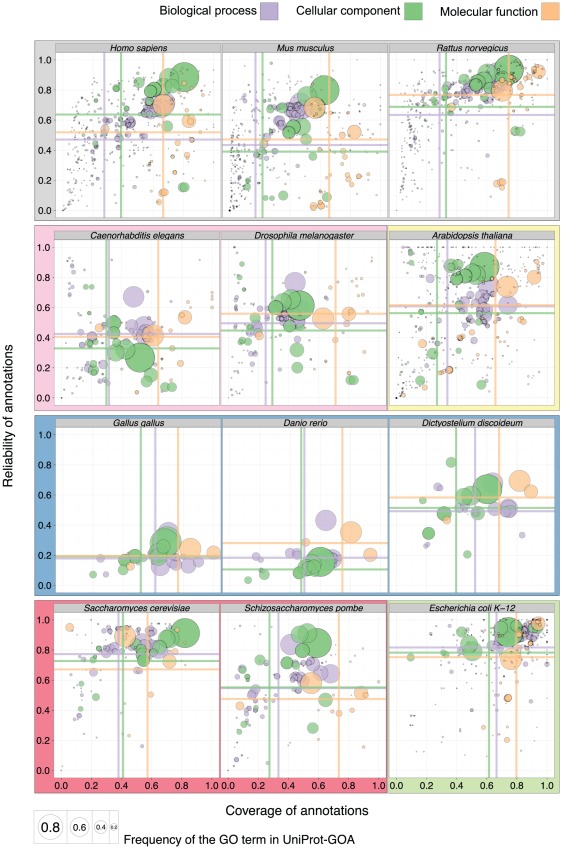
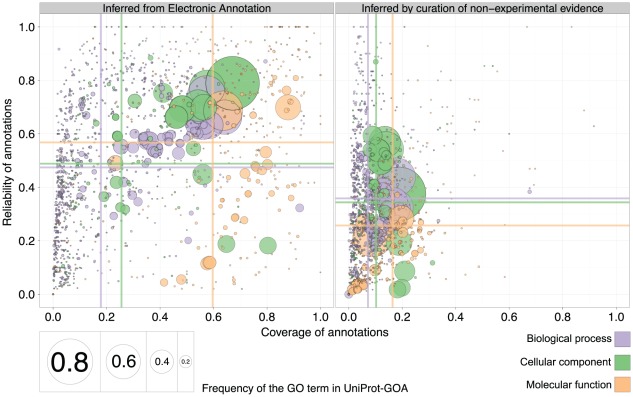
Gene Ontology (GO) has established itself as the undisputed standard for protein function annotation. Most annotations are inferred electronically, i.e. without individual curator supervision, but they are widely considered unreliable. At the same time, we crucially depend on those automated annotations, as most newly sequenced genomes are non-model organisms. Here, we introduce a methodology to systematically and quantitatively evaluate electronic annotations. By exploiting changes in successive releases of the UniProt Gene Ontology Annotation database, we assessed the quality of electronic annotations in terms of specificity, reliability, and coverage. Overall, we not only found that electronic annotations have significantly improved in recent years, but also that their reliability now rivals that of annotations inferred by curators when they use evidence other than experiments from primary literature. This work provides the means to identify the subset of electronic annotations that can be relied upon-an important outcome given that >98% of all annotations are inferred without direct curation.


Conflict of interest statement

The authors have declared that no competing interests exist.

Figures

Figure 1
Figure 1. A list of the Gene Ontology (GO) evidence and reference codes we analyzed.
We group the GO evidence codes in three groups: experimental, non-experimental curated, and electronic. Gray text denotes the evidence codes that were not included in the analysis: they are either used to indicate curation status/progress (ND), are obsolete (NR), or there is not enough data to make a reliable estimate of their quality (ISO, ISA, ISM, IGC, IBA, IBD, IKR, IRD). The subdivision of the evidence codes (green rectangles) reflects the subdivision available in the GO documentation: http://www.geneontology.org/GO.evidence.shtml.
Figure 2
Figure 2. Outline of the strategy to evaluate electronic Gene Ontology annotations.
(A) Reliability measures the proportion of electronic annotations confirmed by future experimental annotations: an electronic annotation in an older database release is either 1) confirmed by a new experimental annotation in the later release, 2) falsified by a new, contradictory experimental annotation (corresponding GO term, but with ‘NOT’ qualifier, which amounts to an explicit rejection), 3) removed from the new UniProt-GOA release (implicit rejection), or 4) unchanged, which is uninformative and does not affect the reliability measure. (B) Coverage measures the extent to which electronic annotations can predict future experimental annotations: an experimental annotation in the newer release is either 1) correctly predicted by an electronic annotation in the older release, or 2) not correctly predicted (“missed”). Note that the strategy is outlined for electronic annotations, but any subset of annotations can be analyzed this way, e.g. annotations assigned using a selection of evidence or reference codes.
Figure 3
Figure 3. Summary statistics of GO terms: (A) specificity, (B) reliability, and (C) coverage.
Each boxplot summarizes the measure of quality indicated on the y-axis for the evaluation period indicated on the x-axis. Lower, mid, and upper horizontal lines denote the first quartile, median and the third quartile, respectively, while the black dots denote the mean values. Outliers (further than 1.5 interquartile range from the respective quartile) are denoted by black points. An asterisk (*) below the boxplot denotes a significant difference of the median with respect to the previous interval, at a confidence level of 0.05 (Mann-Whitney U test, two-tailed).
Figure 4
Figure 4. Reliability of electronic annotations in the 16-01-2008 UniProt-GOA release compared to the specificity of the assigned GO term—Information Content in the 16-01-2008 UniProt-GOA release.
Each point represents one GO term, and its color corresponds to the ontology in the legend. Each boxplot summarizes the reliability of a selection of GO terms: those with specificity in the range denoted by the width of the boxplot. Lower, mid, and upper horizontal lines denote the first quartile, median and the third quartile, respectively. Vertical lines reach the 1.5 interquartile ranges from the respective quartiles or reach the extreme value, whichever is closer. To be visualized in these plots, a GO term needs to have assigned at least 10 electronic annotations in the 16-01-2008 UniProt-GOA release and at least 10 experimental annotations in the 11-01-2011 UniProt-GOA release.
Figure 5
Figure 5. The quality of the 16-01-2008 UniProt-GOA release, evaluated by the 11-01-2011 UniProt-GOA release.
A scatterplot of coverage compared to the reliability for the GO terms of the three ontologies: Biological Process, Cellular Component, and Molecular Function. The area of the disc reflects the frequency of the GO term in the 16-01-2008 UniProt-GOA release. The colored lines correspond to the mean values for the respective axes. To be visualized in this plot, a GO term needs to have assigned at least 10 electronic annotations in the 16-01-2008 UniProt-GOA release and at least 10 experimental annotations in the 11-01-2011 UniProt-GOA release. An interactive plot is available at http://people.inf.ethz.ch/skuncan/SupplementaryVisualization1.html.
Figure 6
Figure 6. The quality of the 16-01-2008 UniProt-GOA release, evaluated by the 11-01-2011 UniProt-GOA release.
Each reference code is evaluated separately: (A) Inferred from Enzyme Commission, (B) Inferred from UniProt Subcellular Location terms, (C) Inferred from UniProtKB keywords, (D) Inferred from Ensembl Compara, (E) Inferred from HAMAP2GO, and (F) Inferred from InterPro. The 12 model organisms included in the analysis are Homo sapiens, Mus musculus, Rattus norvegicus, Caenorhabditis elegans, Drosophila melanogaster, Arabidopsis thaliana, Gallus gallus, Danio rerio, Dictyostelium discoideum, Saccharomyces cerevisiae, Schizosaccharomyces pombe, and Escherichia coli K-12. The ontology is denoted by the color of the disc, while the area of the disc reflects the frequency of the GO term in the 16-01-2008 UniProt-GOA release. The colored lines correspond to the mean values for the respective axes. To be visualized in this plot, a GO term needs to have assigned at least 10 electronic annotations in the 16-01-2008 UniProt-GOA release and at least 10 experimental annotations in the 11-01-2011 UniProt-GOA release.
Figure 7
Figure 7. Quality of the 16-01-2008 UniProt-GOA release, evaluated by the 11-01-2011 UniProt-GOA release; each model organism is evaluated separately.
Common background shading denotes a depiction of the same set of GO terms (full data is presented in Fig. S8 in Text S1). The ontology is denoted by the color of the disc, while the area of the disc reflects the frequency of the GO term in the 16-01-2008 UniProt-GOA release. To be visualized in this plot, a GO term needs to have assigned at least 10 electronic annotations in the 16-01-2008 UniProt-GOA release and at least 10 experimental annotations in the 11-01-2011 UniProt-GOA release for each model organism. The colored lines correspond to the mean values for the respective axes.
Figure 8
Figure 8. Quality of electronic and curated annotations on a common set of GO terms.
Quality of the 16-01-2008 UniProt-GOA release is evaluated by the 11-01-2011 UniProt-GOA release; coverage is on the x-axis and reliability is on the y-axis. The ontology is denoted by the color of the disc, while the area of the disc reflects the frequency of the GO term in the 16-01-2008 UniProt-GOA release. The colored lines correspond to the mean values for the respective axes. To be visualized in the plot, a GO term needs to have assigned at least 10 electronic/curated annotations in the 16-01-2008 UniProt-GOA release, and at least 10 experimental annotations in the 11-01-2011 UniProt-GOA release.

References

    1. Gene Ontology Consortium. The Gene Ontology in 2010: extensions and refinements. Nucleic Acids Res. 2010;38:D331–335. - PMC - PubMed
    1. du Plessis L, Skunca N, Dessimoz C. The what, where, how and why of gene ontology–a primer for bioinformaticians. Brief Bioinform. 2011;12:723–735. - PMC - PubMed
    1. Dolan ME, Ni L, Camon E, Blake JA. A procedure for assessing GO annotation consistency. Bioinformatics. 2005;21(Suppl 1):i136–143. - PubMed
    1. Jones CE, Brown AL, Baumann U. Estimating the annotation error rate of curated GO database sequence annotations. BMC Bioinformatics. 2007;8:170. - PMC - PubMed
    1. del Pozo A, Pazos F, Valencia A. Defining functional distances over Gene Ontology. BMC Bioinformatics. 2008;9:50. - PMC - PubMed

Publication types

MeSH terms

LinkOut - more resources