

Classification of Traditional Chinese Medicine Syndromes in Patients with Chronic Hepatitis B by SELDI-Based ProteinChip Analysis
- PMID: 22693531
- PMCID: PMC3369440
- DOI: 10.1155/2012/626320
Classification of Traditional Chinese Medicine Syndromes in Patients with Chronic Hepatitis B by SELDI-Based ProteinChip Analysis
Abstract
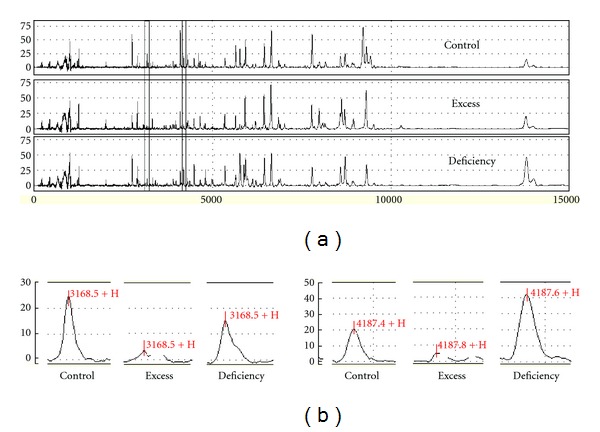
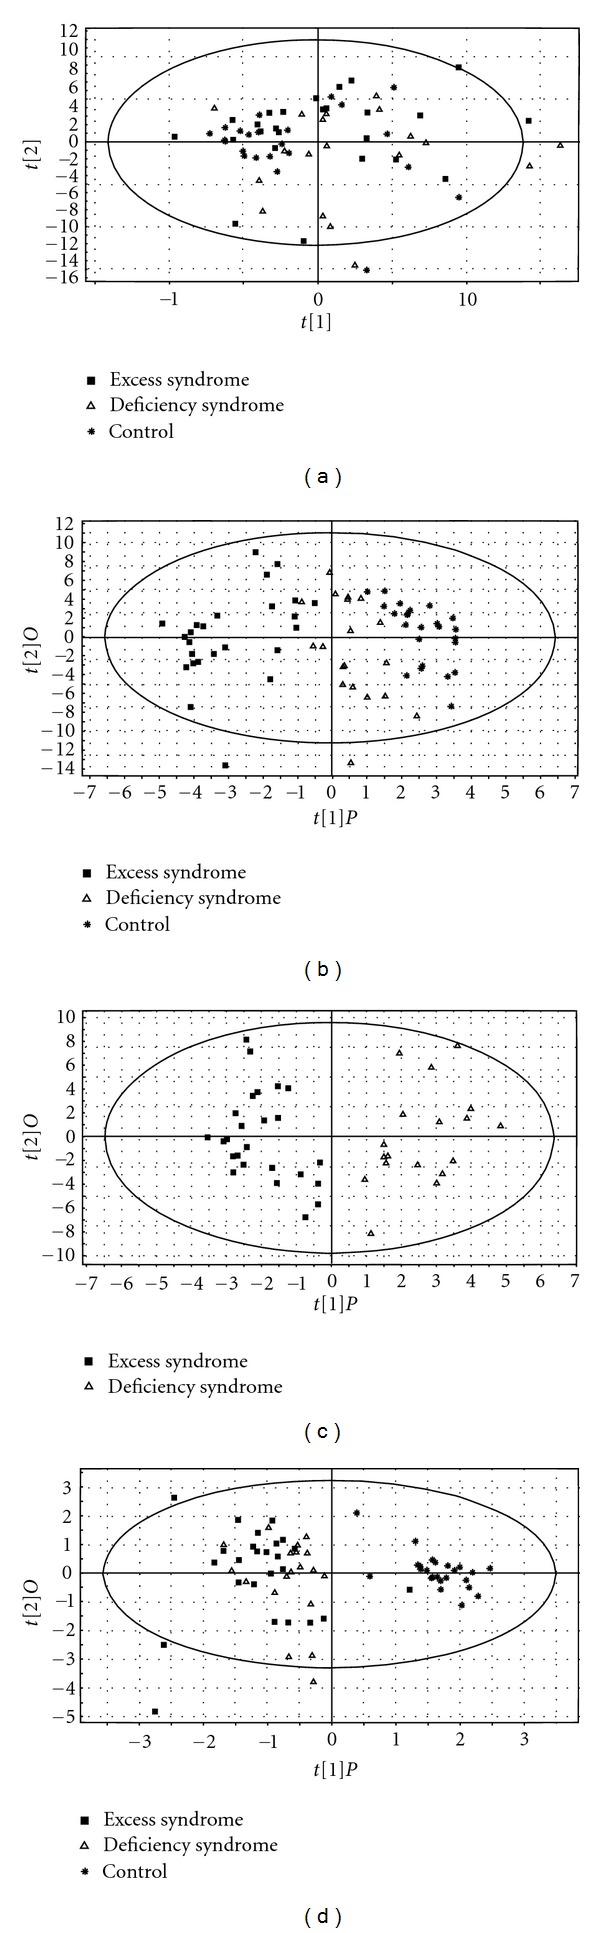
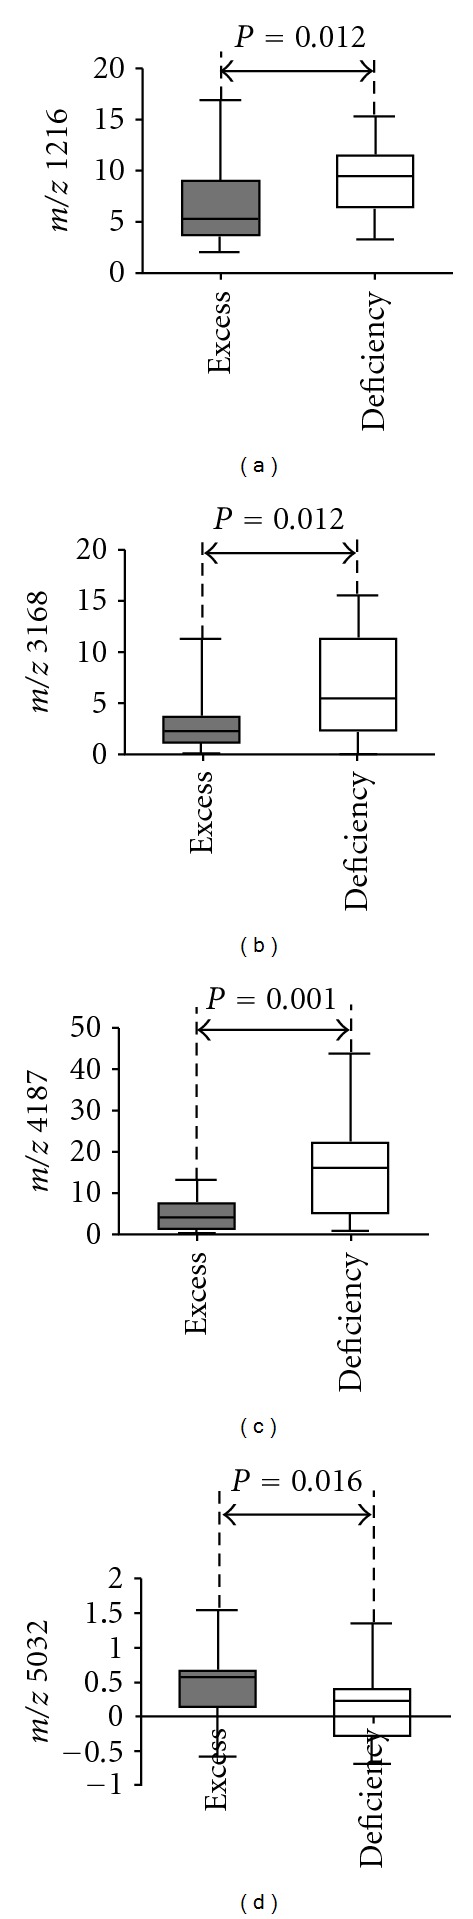
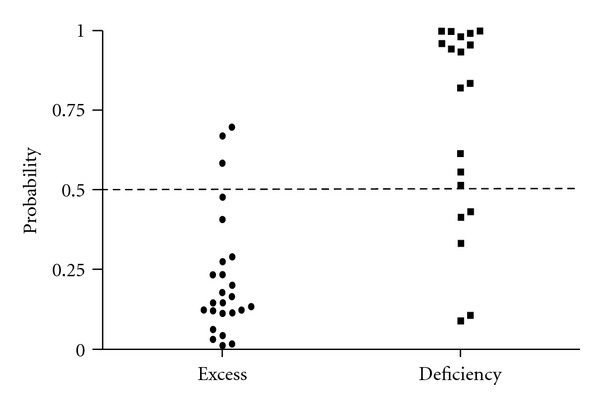
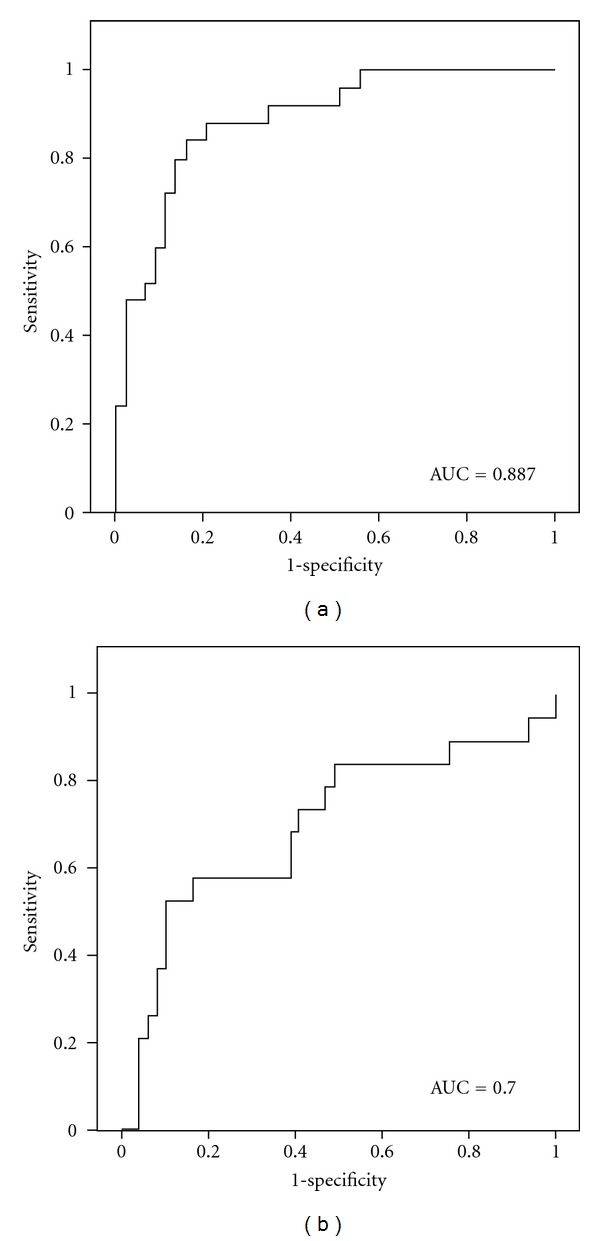
Traditional Chinese medicine (TCM) syndrome, also called ZHENG, is the basis concept of TCM theory. It plays an important role in TCM practice. There are excess and deficiency syndromes in TCM syndrome. They are the common syndromes in chronic hepatitis B (CHB) patients. Here we aim to explore serum protein profiles and potential biomarkers for classification of TCM syndromes in CHB patients. 24 healthy controls and two cohorts of CHB patients of excess syndrome (n = 25) or deficiency syndrome (n = 19) were involved in this study. Protein profiles were obtained by surface-enhanced laser desorption ionization time-flight mass spectrometry (SELDI-TOF/MS) and multiple analyses were performed. Based on SELDI ProteinChip data, healthy controls and CHB patients or excess and deficiency syndromes in CHB patients were obviously differentiated by orthogonal partial least square (OPLS) analysis. Two significant serum proteins (m/z 4187 and m/z 5032) for classifying excess and deficiency syndromes were found. Moreover, the area under the receiver operating characteristic (ROC) curve was 0.887 for classifying excess and nonexcess syndrome, and 0.700 for classifying deficiency and nondeficiency syndrome, respectively. Therefore, the present study provided the possibility of TCM syndrome classification in CHB patients using a universally acceptable scientific approach.
Figures
References
-
- Jiang WY. Therapeutic wisdom in traditional Chinese medicine: a perspective from modern science. Trends in Pharmacological Sciences. 2005;26(11):558–563. - PubMed
-
- Liu Y, Liu P, Dai R, et al. Analysis of plasma proteome from cases of the different traditional Chinese medicine syndromes in patients with chronic hepatitis B. Journal of Pharmaceutical and Biomedical Analysis. 2012;59(1):173–178. - PubMed
-
- Xu W, Su LQ, Li HJ. Research advances and clinical evaluation of drugs for hepatitis B. Chinese Journal of Hospital Pharmacy. 2008;28(9):737–739.
-
- Zuberovic A, Wetterhall M, Hanrieder J, Bergquist J. CE MALDI-TOF/TOF MS for multiplexed quantification of proteins in human ventricular cerebrospinal fluid. Electrophoresis. 2009;30(10):1836–1843. - PubMed
LinkOut - more resources
Full Text Sources
