. 2012;7(5):e37997.
doi: 10.1371/journal.pone.0037997. Epub 2012 May 31.

From sensor data to animal behaviour: an oystercatcher example

Affiliations

From sensor data to animal behaviour: an oystercatcher example

Judy Shamoun-Baranes et al. PLoS One. 2012.

Abstract

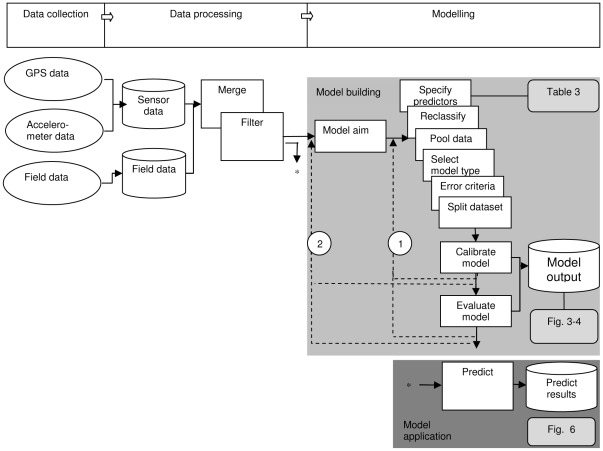
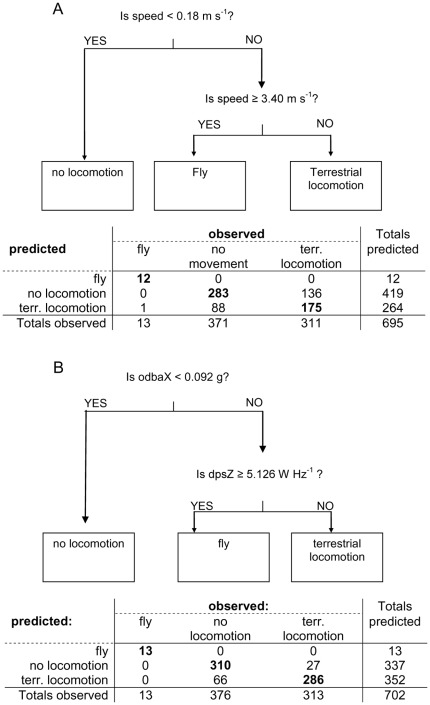
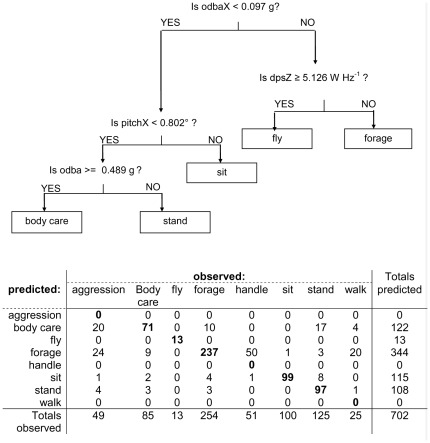
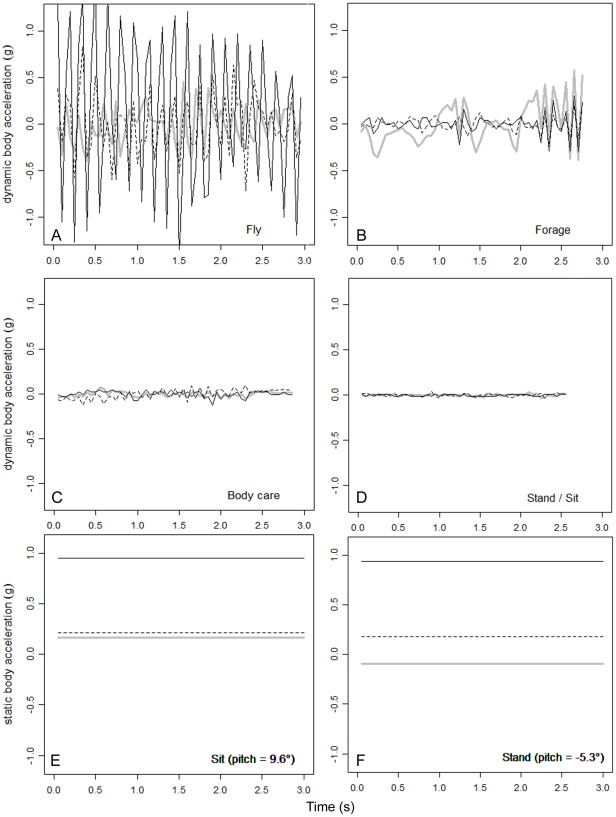
Animal-borne sensors enable researchers to remotely track animals, their physiological state and body movements. Accelerometers, for example, have been used in several studies to measure body movement, posture, and energy expenditure, although predominantly in marine animals. In many studies, behaviour is often inferred from expert interpretation of sensor data and not validated with direct observations of the animal. The aim of this study was to derive models that could be used to classify oystercatcher (Haematopus ostralegus) behaviour based on sensor data. We measured the location, speed, and tri-axial acceleration of three oystercatchers using a flexible GPS tracking system and conducted simultaneous visual observations of the behaviour of these birds in their natural environment. We then used these data to develop three supervised classification trees of behaviour and finally applied one of the models to calculate time-activity budgets. The model based on accelerometer data developed to classify three behaviours (fly, terrestrial locomotion, and no movement) was much more accurate (cross-validation error = 0.14) than the model based on GPS-speed alone (cross-validation error = 0.35). The most parsimonious acceleration model designed to classify eight behaviours could distinguish five: fly, forage, body care, stand, and sit (cross-validation error = 0.28); other behaviours that were observed, such as aggression or handling of prey, could not be distinguished. Model limitations and potential improvements are discussed. The workflow design presented in this study can facilitate model development, be adapted to a wide range of species, and together with the appropriate measurements, can foster the study of behaviour and habitat use of free living animals throughout their annual routine.


Conflict of interest statement

Competing Interests: The authors have declared that no competing interests exist.

Figures

Figure 1
Figure 1. The study area on the island of Schiermonnikoog, the Netherlands (53.29°N, 06.10°E) at different spatial scales.
The points represent GPS fixes of three oystercatchers (green – tag 166, red – tag 167, blue – tag 169; Table S1) from 1 July 2009 to 31 July 2009, with consecutive points connected by lines. The black circles are the nests of these birds. The locations of the observation towers are indicated by a square and the base station by a triangle. Black lines represents creeks, dark grey lines represent urban infrastructure.
Figure 2
Figure 2. A schematic workflow of the different methodological steps conducted in this study.
The workflow is broken down into three main categories of activity shown on the upper bar: Data collection, Data processing and Modelling. The objects in the grey rectangle indicate the aspects involved in building classification models and the objects in the dark grey rectangle indicate application of the classification models for diverse analyses such as calculating time budgets. Ovals indicate data in various formats (files from data loggers, written field forms, etc). Cylinders indicate information that is stored in a database. White rectangles indicate (computational) activities and decisions. Solid arrows present the workflow to move from field data to the establishment and application of a model. Dashed arrows present feed-back loops where a certain part of the workflow is repeated in response to progressive insights (only the most important feed-back loops are shown). Feed-back loops are present from a point after model calibration as well as a point after model evaluation back to the beginning of the modelling sequence (2) or later in the modelling sequence (1). These steps are generalized so that they can be applied to other studies, for example visual observations may be replaced by video observations or expert interpretation of sensor data.
Figure 3
Figure 3. Decision tree and confusion matrix for models S3 and SA3.
For model S3 (A) and model SA3 (B), the number of observations correctly classified per behaviour is shown in bold. See Table 2 for a description of the predictor variables. Out of the 702 observations, there were no speed measurements in 7 cases, hence the sample size of 695 for model S3.
Figure 4
Figure 4. Decision tree and confusion matrix for model SA8.
The number of observations correctly classified per behaviour is shown in bold. See Table 2 for a description of the predictor variables.
Figure 5
Figure 5. Examples of behaviours with characteristic signals from dynamic acceleration and static acceleration.
Characteristic signals from dynamic acceleration (A–D) and static acceleration (E–F) are shown. In all panels, acceleration in the surge (X) axis is shown with a continuous grey line, in the sway (Y) axis with a dashed line and in the heave (Z) axis with a continuous black line. Fly and forage (A, B) are especially characterized by high-amplitudes of all dynamic acceleration components, but the frequency of the signals is higher for fly than it is for forage (especially in the Z direction, see dpsZ in Figure 4). Many of the accelerometer signals for foraging are characterized by the alternation between relatively smooth lateral movement (changes in acceleration predominantly in the surge axis) and short bursts of high frequency changes in acceleration in all three axes (e.g. catching prey, at 2.2 s panel B, see also Video S1). The changes in dynamic acceleration for body care (C) are much smaller than for fly and forage, but still considerably higher than for stand and sit (D, see also odbaX and odba in Figure 4). The static acceleration can be used to distinguish sit (E) and stand (F) due to differences in body posture (see pitchX in Figure 4).
Figure 6
Figure 6. Diurnal and nocturnal time budget of one oystercatcher during July 2009, using model SA8 to classify behaviours.
Diurnal (top) and nocturnal (bottom) time budgets for one oystercatcher (logger 169, Table S1) during July 2009, using model SA8 (Figure 4) to classify behaviours. The locations of each behaviour (fly, forage, body care, stand and sit) are presented on the map; the colours of the icons on the map correspond to those in the time budget bar graphs.

References

    1. Norberg RA. An ecological theory on foraging time and energetics and choice of optimal food-searching method. J Anim Ecol. 1977;46:511–529.
    1. Ropert-Coudert Y, Grémillet D, Kato A, Ryan PG, Naito Y, et al. A fine-scale time budget of Cape gannets provides insights into the foraging strategies of coastal seabirds. Anim Behav. 2004;67:985–992.
    1. Halsey LG, White CR. Measuring Energetics and Behaviour Using Accelerometry in Cane Toads Bufo marinus. PLoS ONE. 2010;5:e10170. - PMC - PubMed
    1. Aviles JM. Common cranes Grus grus and habitat management in holm oak dehesas of Spain. Biodivers Conserv. 2004;13:2015–2025.
    1. Bograd SJ, Block BA, Costa DP, Godley BJ. Biologging technologies: new tools for conservation. Introduction. Endangered Species Research. 2010;10:1–7.

Publication types