Clinical Trial
. 2012;7(6):e38511.
doi: 10.1371/journal.pone.0038511. Epub 2012 Jun 5.

Dissociable influences of auditory object vs. spatial attention on visual system oscillatory activity

Affiliations
Clinical Trial

Dissociable influences of auditory object vs. spatial attention on visual system oscillatory activity

Jyrki Ahveninen et al. PLoS One. 2012.

Abstract

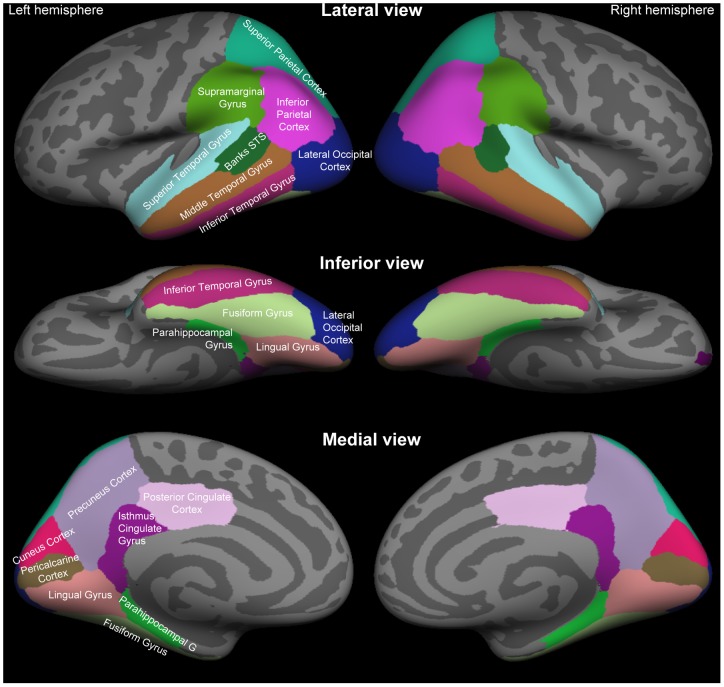
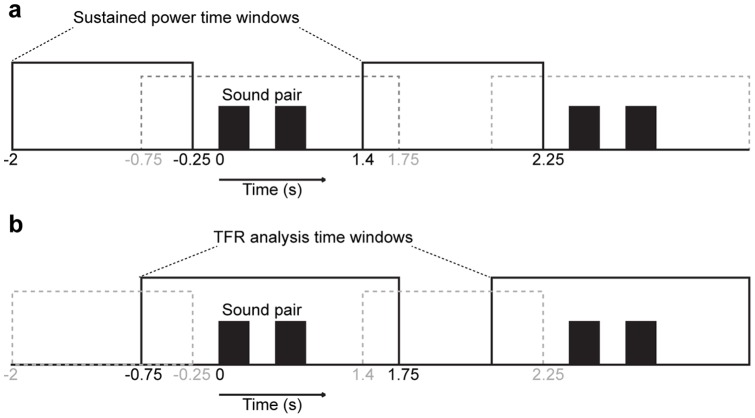
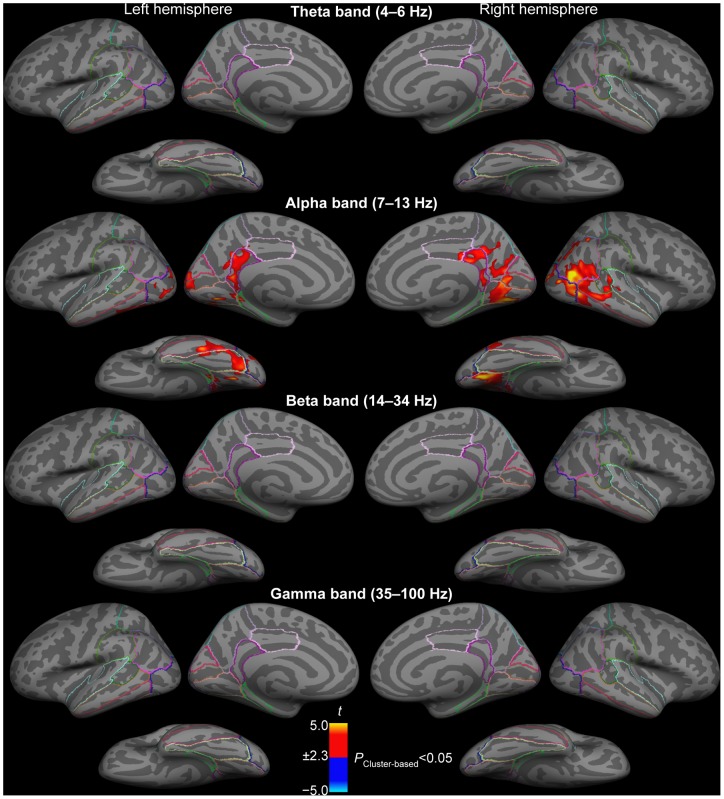
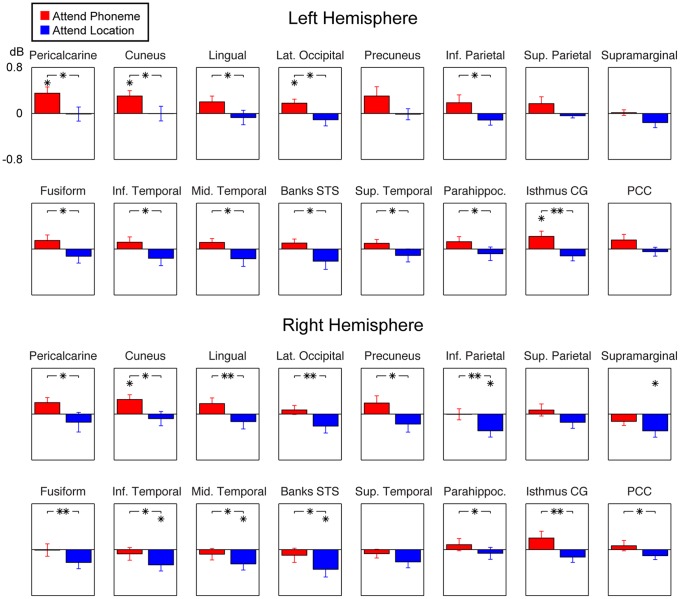
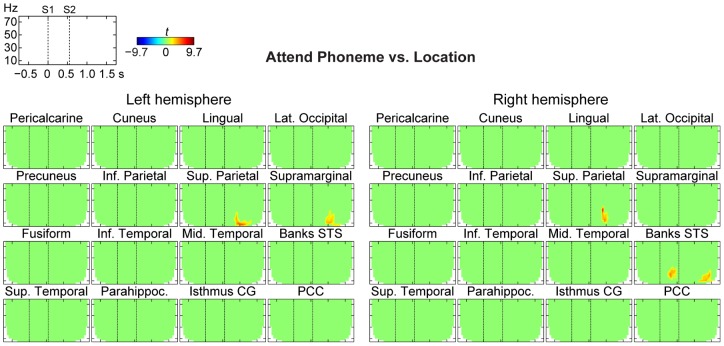
Given that both auditory and visual systems have anatomically separate object identification ("what") and spatial ("where") pathways, it is of interest whether attention-driven cross-sensory modulations occur separately within these feature domains. Here, we investigated how auditory "what" vs. "where" attention tasks modulate activity in visual pathways using cortically constrained source estimates of magnetoencephalograpic (MEG) oscillatory activity. In the absence of visual stimuli or tasks, subjects were presented with a sequence of auditory-stimulus pairs and instructed to selectively attend to phonetic ("what") vs. spatial ("where") aspects of these sounds, or to listen passively. To investigate sustained modulatory effects, oscillatory power was estimated from time periods between sound-pair presentations. In comparison to attention to sound locations, phonetic auditory attention was associated with stronger alpha (7-13 Hz) power in several visual areas (primary visual cortex; lingual, fusiform, and inferior temporal gyri, lateral occipital cortex), as well as in higher-order visual/multisensory areas including lateral/medial parietal and retrosplenial cortices. Region-of-interest (ROI) analyses of dynamic changes, from which the sustained effects had been removed, suggested further power increases during Attend Phoneme vs. Location centered at the alpha range 400-600 ms after the onset of second sound of each stimulus pair. These results suggest distinct modulations of visual system oscillatory activity during auditory attention to sound object identity ("what") vs. sound location ("where"). The alpha modulations could be interpreted to reflect enhanced crossmodal inhibition of feature-specific visual pathways and adjacent audiovisual association areas during "what" vs. "where" auditory attention.


Conflict of interest statement

Competing Interests: The authors have declared that no competing interests exist.

Figures

Figure 1
Figure 1. Standard anatomical parcellation of the posterior cortical surface.
Color-coded labels of anatomical ROI labels based on the Desikan-Killiany atlas have been shown in the lateral (Top), inferior (Middle), and medial (Bottom) views of the FreeSurfer inflated standard-brain cortical surface. Abbreviation: STS, superior temporal sulcus.
Figure 2
Figure 2. Oscillatory analysis time windows.
(a) Sustained power analysis time window. Spectral analyses of sustained oscillatory activities were conducted in 1.75 s time windows between sound-pair presentations (solid black rectangles). During this time window, activations driven by the stimuli themselves were assumed to be minimal, while the endogenous processes related to the ongoing selective attention task were presumably strongly activated. (b) Analysis window of time-frequency representations (TFR). Dynamic oscillatory power changes were analyzed from a 2.5 s time window overlapping with sound-pair presentations (solid black rectangles). Note that the actual time period for which the power values were obtained is shorter, given the boundary effects in the sliding-window power analysis (e.g., at the lowest frequency of 4 Hz, the effective power time window was −0.38−1.38 s, see Fig. 5 ).
Figure 3
Figure 3. Comparisons of power changes of sustained oscillatory activity between auditory attention to phonetic vs. sound location features.
The figure shows t values masked to locations where the power differences between Attend Phoneme vs. Location conditions were statistically significant (P<0.05, cluster-based randomization test). For reference, the results have been shown with the outlines of standard anatomical atlas labels specified in detail in Fig. 1. While there were no significant effects at other frequency ranges, the power of background alpha activity was significantly stronger during auditory attention to phonetic than spatial sound features in several visual cortex areas including the primary visual cortex (pericalcarine cortex), left cuneus cortex, lingual gyrus, inferior temporal gyrus, fusiform gyrus, and lateral occipital cortex. Significant increases of alpha activity during auditory phoneme vs. location attention were also observed medially in the retrosplenial complex (∼isthmus of cingulate gyrus / precuneus) and precuneus, and laterally in the right inferior parietal cortex, right banks of superior temporal sulcus (STS). In lateral cortex areas, significant alpha increases during phonetic vs. spatial auditory attention also emerged near the right-hemispheric area MT (∼near the junction of lateral occipital, inferior parietal, and middle temporal areas).
Figure 4
Figure 4. Regions-of-interest (ROI) analyses of alpha activity.
The figure shows 10 × base-10 logarithm normalized ROI alpha power estimates during Attend Phoneme and Attend Location conditions, relative to the Passive condition. Consistent with the whole-cortex mapping analyses shown above, these a priori comparisons of means suggest significant increases of baseline alpha power in several parietal and occipital ROIs during Attend Phoneme vs. Attend Location conditions, indicated by the asterisks with the brackets (*P<0.05, **P<0.01; paired t test). In addition to the main comparisons between the two active conditions, statistical comparisons of the 10 × base-10 logarithm normalized relative power (Attend Phoneme or Attend Location relative to Passive) vs. zero are also shown, to help determine the polarity of attentional modulations relative to the Passive condition, indicated by the asterisk symbols atop each relevant bar (*P<0.05, t test). The normalized amplitude scale is shown in the uppermost left graph.
Figure 5
Figure 5. Dynamic time-frequency power analyses of baseline-corrected oscillatory estimates.
The figure shows t values masked to time-frequency bins where the power differences between Attend Phoneme vs. Location conditions were statistically significant (P<0.05, cluster-based randomization test). These analyses, from which the account of sustained power changes reported in Figures 2 and 3 have been removed by pre-stimulus baseline correction, transient power changes centered mainly at the alpha range, but also extended to theta and beta ranges, mainly 400–600 ms after the onset of the second sound in the pair (S2).

Similar articles

Cited by

References

    1. Rauschecker JP, Tian B. Mechanisms and streams for processing of “what” and “where” in auditory cortex. Proc Natl Acad Sci U S A. 2000;97:11800–11806. - PMC - PubMed
    1. Ahveninen J, Jääskeläinen IP, Raij T, Bonmassar G, Devore S, et al. Task-modulated “what” and “where” pathways in human auditory cortex. Proc Natl Acad Sci U S A. 2006;103:14608–14613. - PMC - PubMed
    1. Ungerleider L, Mishkin M. Analysis of Visual Behavior. Cambridge, MA: MIT Press; 1982. Ingle D, Goodale M, Mansfield R, editors.
    1. Schroeder CE, Foxe J. Multisensory contributions to low-level, ‘unisensory’ processing. Curr Opin Neurobiol. 2005;15:454–458. - PubMed
    1. Alain C, Arnott SR, Hevenor S, Graham S, Grady CL. “What” and “where” in the human auditory system. Proc Natl Acad Sci U S A. 2001;98:12301–12306. - PMC - PubMed

Publication types