Impact of N-terminal acetylation of α-synuclein on its random coil and lipid binding properties
- PMID: 22694188
- PMCID: PMC3383124
- DOI: 10.1021/bi300642h
Impact of N-terminal acetylation of α-synuclein on its random coil and lipid binding properties
Abstract
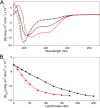
N-Terminal acetylation of α-synuclein (aS), a protein implicated in the etiology of Parkinson's disease, is common in mammals. The impact of this modification on the protein's structure and dynamics in free solution and on its membrane binding properties has been evaluated by high-resolution nuclear magnetic resonance and circular dichroism (CD) spectroscopy. While no tetrameric form of acetylated aS could be isolated, N-terminal acetylation resulted in chemical shift perturbations of the first 12 residues of the protein that progressively decreased with the distance from the N-terminus. The directions of the chemical shift changes and small changes in backbone (3)J(HH) couplings are consistent with an increase in the α-helicity of the first six residues of aS, although a high degree of dynamic conformational disorder remains and the helical structure is sampled <20% of the time. Chemical shift and (3)J(HH) data for the intact protein are virtually indistinguishable from those recorded for the corresponding N-terminally acetylated and nonacetylated 15-residue synthetic peptides. An increase in α-helicity at the N-terminus of aS is supported by CD data on the acetylated peptide and by weak medium-range nuclear Overhauser effect contacts indicative of α-helical character. The remainder of the protein has chemical shift values that are very close to random coil values and indistinguishable between the two forms of the protein. No significant differences in the fibrillation kinetics were observed between acetylated and nonacetylated aS. However, the lipid binding properties of aS are strongly impacted by acetylation and exhibit distinct behavior for the first 12 residues, indicative of an initiation role for the N-terminal residues in an "initiation-elongation" process of binding to the membrane.
Figures


Similar articles
-
N-terminal acetylation stabilizes N-terminal helicity in lipid- and micelle-bound α-synuclein and increases its affinity for physiological membranes.J Biol Chem. 2014 Feb 7;289(6):3652-65. doi: 10.1074/jbc.M113.512459. Epub 2013 Dec 12. J Biol Chem. 2014. PMID: 24338013 Free PMC article.
-
Bioinorganic Chemistry of Parkinson's Disease: Affinity and Structural Features of Cu(I) Binding to the Full-Length β-Synuclein Protein.Inorg Chem. 2017 Sep 5;56(17):10387-10395. doi: 10.1021/acs.inorgchem.7b01292. Epub 2017 Aug 18. Inorg Chem. 2017. PMID: 28820253
-
N-terminal acetylation of α-synuclein induces increased transient helical propensity and decreased aggregation rates in the intrinsically disordered monomer.Protein Sci. 2012 Jul;21(7):911-7. doi: 10.1002/pro.2088. Epub 2012 Jun 11. Protein Sci. 2012. PMID: 22573613 Free PMC article.
-
The Role of Lipids Interacting with α-Synuclein in the Pathogenesis of Parkinson's Disease.J Parkinsons Dis. 2017;7(3):433-450. doi: 10.3233/JPD-171103. J Parkinsons Dis. 2017. PMID: 28671142 Review.
-
Exploring the accessible conformations of N-terminal acetylated α-synuclein.FEBS Lett. 2013 Apr 17;587(8):1128-38. doi: 10.1016/j.febslet.2013.02.049. Epub 2013 Mar 13. FEBS Lett. 2013. PMID: 23499431 Free PMC article. Review.
Cited by
-
Intracellular Protein-Lipid Interactions Studied by Rapid-Scan Electron Paramagnetic Resonance Spectroscopy.J Phys Chem Lett. 2021 Mar 11;12(9):2471-2475. doi: 10.1021/acs.jpclett.0c03583. Epub 2021 Mar 5. J Phys Chem Lett. 2021. PMID: 33663214 Free PMC article.
-
Hydrogen exchange of disordered proteins in Escherichia coli.Protein Sci. 2015 May;24(5):706-13. doi: 10.1002/pro.2643. Epub 2015 Mar 2. Protein Sci. 2015. PMID: 25611326 Free PMC article.
-
Aromaticity at position 39 in α-synuclein: A modulator of amyloid fibril assembly and membrane-bound conformations.Protein Sci. 2022 Jul;31(7):e4360. doi: 10.1002/pro.4360. Protein Sci. 2022. PMID: 35762717 Free PMC article.
-
Intrinsically disordered proteins in synaptic vesicle trafficking and release.J Biol Chem. 2019 Mar 8;294(10):3325-3342. doi: 10.1074/jbc.REV118.006493. Epub 2019 Jan 30. J Biol Chem. 2019. PMID: 30700558 Free PMC article. Review.
-
Salient Features of Monomeric Alpha-Synuclein Revealed by NMR Spectroscopy.Biomolecules. 2020 Mar 10;10(3):428. doi: 10.3390/biom10030428. Biomolecules. 2020. PMID: 32164323 Free PMC article. Review.
References
-
- Cookson M. R. (2005) The biochemistry of Parkinson’s disease. Annu. Rev. Biochem. 74, 29–52. - PubMed
-
- Simon-Sanchez J.; Schulte C.; Bras J. M.; Sharma M.; Gibbs J. R.; Berg D.; Paisan-Ruiz C.; Lichtner P.; Scholz S. W.; Hernandez D. G.; Kruger R.; Federoff M.; Klein C.; Goate A.; Perlmutter J.; Bonin M.; Nalls M. A.; Illig T.; Gieger C.; Houlden H.; Steffens M.; Okun M. S.; Racette B. A.; Cookson M. R.; Foote K. D.; Fernandez H. H.; Traynor B. J.; Schreiber S.; Arepalli S.; Zonozi R.; Gwinn K.; van der Brug M.; Lopez G.; Chanock S. J.; Schatzkin A.; Park Y.; Hollenbeck A.; Gao J. J.; Huang X. M.; Wood N. W.; Lorenz D.; Deuschl G.; Chen H. L.; Riess O.; Hardy J. A.; Singleton A. B.; Gasser T. (2009) Genome-wide association study reveals genetic risk underlying Parkinson’s disease. Nat. Genet. 41, 1308–1312. - PMC - PubMed
-
- Breydo L.; Wu J. W.; Uversky V. N. (2012) α-Synuclein misfolding and Parkinson’s disease. Biochim. Biophys. Acta 1822, 261–285. - PubMed
-
- Eliezer D.; Kutluay E.; Bussell R.; Browne G. (2001) Conformational properties of α-synuclein in its free and lipid-associated states. J. Mol. Biol. 307, 1061–1073. - PubMed
Publication types
MeSH terms
Substances
Grants and funding
LinkOut - more resources
Full Text Sources
Other Literature Sources
Research Materials

