. 2012 Jun 13:11:73.
doi: 10.1186/1476-511X-11-73.

Automated diagnosis of diabetic retinopathy and glaucoma using fundus and OCT images

Affiliations

Automated diagnosis of diabetic retinopathy and glaucoma using fundus and OCT images

Arulmozhivarman Pachiyappan et al. Lipids Health Dis. .

Abstract

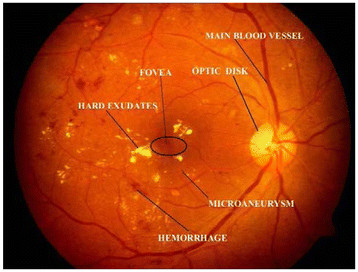
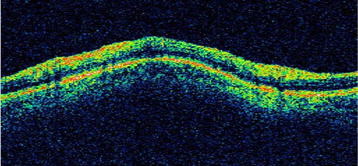
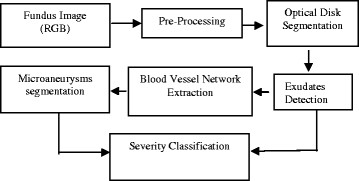
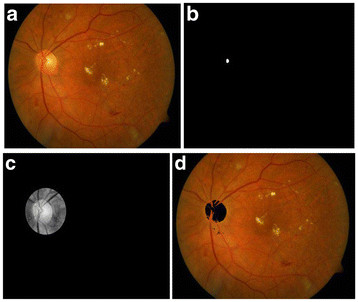
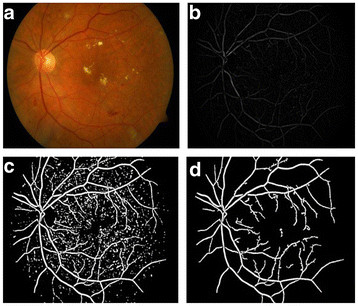
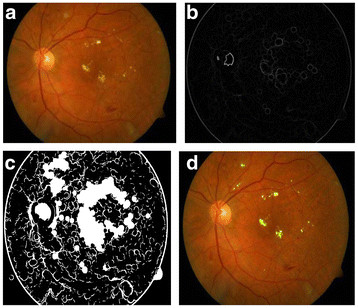
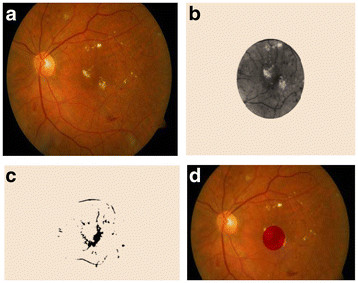
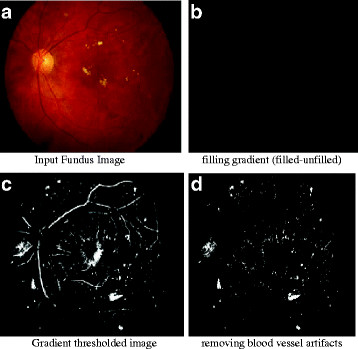
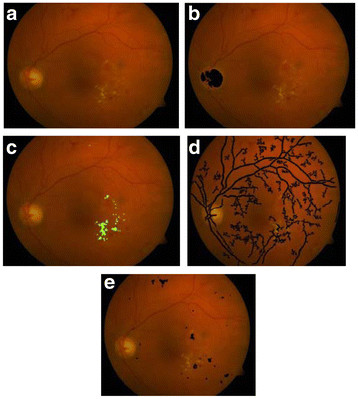
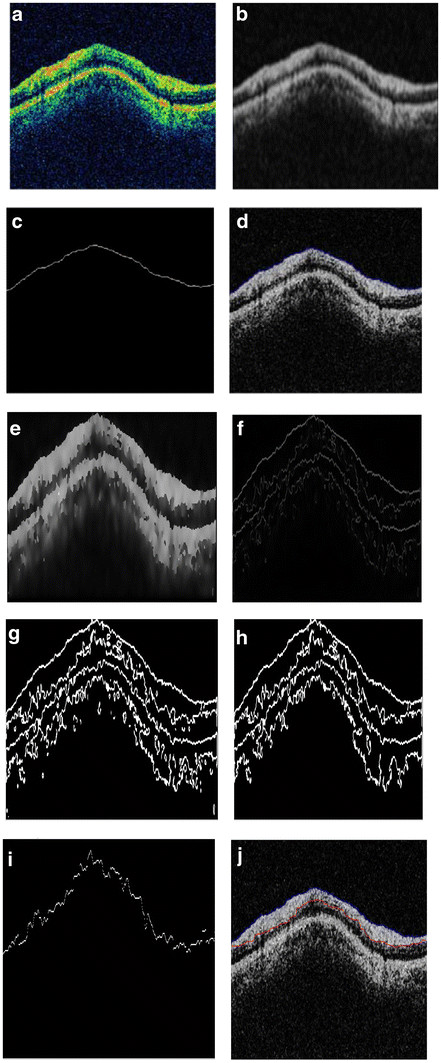
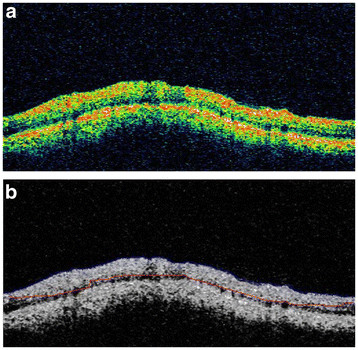
We describe a system for the automated diagnosis of diabetic retinopathy and glaucoma using fundus and optical coherence tomography (OCT) images. Automatic screening will help the doctors to quickly identify the condition of the patient in a more accurate way. The macular abnormalities caused due to diabetic retinopathy can be detected by applying morphological operations, filters and thresholds on the fundus images of the patient. Early detection of glaucoma is done by estimating the Retinal Nerve Fiber Layer (RNFL) thickness from the OCT images of the patient. The RNFL thickness estimation involves the use of active contours based deformable snake algorithm for segmentation of the anterior and posterior boundaries of the retinal nerve fiber layer. The algorithm was tested on a set of 89 fundus images of which 85 were found to have at least mild retinopathy and OCT images of 31 patients out of which 13 were found to be glaucomatous. The accuracy for optical disk detection is found to be 97.75%. The proposed system therefore is accurate, reliable and robust and can be realized.


Figures

Figure 1
Figure 1
Typical fundus retinal image.
Figure 2
Figure 2
Retinal Nerve Fibre Layer in a typical OCT Image.
Figure 3
Figure 3
Flow chart for the automated diagnosis of Diabetic Retinopathy using fundus image.
Figure 4
Figure 4
Optical Disc detection process. (a) Input fundus image, (b) Optical Disc localization, (c) Optical Disc region, (d) Optical Disc detected.
Figure 5
Figure 5
Blood vessel detection process. (a) Input fundus image, (b) Fundus gradient image, (c) Thresholded fundus gradient image, (d) Blood vessels detected.
Figure 6
Figure 6
(a) Input Fundus Image, (b) Dilation gradient image, (c) Thresholded and filled image, (d) Exudates detected.
Figure 7
Figure 7
(a) Input Fundus Image, (b) Possible Fovea region, (c) Threshold region, (d) Fovea detected.
Figure 8
Figure 8
(a) Input Fundus Image, (b) filling gradient (filled-unfilled), (c) Gradient thresholded image, (d) removing blood vessel artifacts.
Figure 9
Figure 9
Total exudate area for above patient is 5196 pixels, total MAHM area is 3991 pixels and there is no exudate and MAHM pixel in fovea. Therefore the DR condition is classified as moderate. (a) Input RGB fundus image, (b) Optical Disk Detected, (c) Exudates Detection, (d) Blood vessel segmentation, (e) MAHM detected.
Figure 10
Figure 10
(a) input OCT image; (b) Gaussian smoothed median filtered image; (c) initial estimate of the anterior boundary; (d) accurately detected anterior boundary after applying snake algorithm; (e) Smoothed image with edges preserved using anisotropic diffusion; (f) edge field of image in 10(e); (g) binarized version of image in 10(f); (h) areas less than 100 pixels are removed; (i) initial estimate of Posterior Boundary; (j) Accurately detected posterior boundary.
Figure 11
Figure 11
(a): Input OCT image, (b): Anterior and posterior boundaries in blue and red respectively.

Similar articles

Cited by

References

    1. Wild S, Roglic G, Green A, Sicree R, King H. Global prevalence of diabetes: estimates for the year 2000 and projections for 2030. Diabetes Care. 2004;27:1047–1053. doi: 10.2337/diacare.27.5.1047. - DOI - PubMed
    1. Day C. The rising tide of type 2 diabetes. Br J Diabetes Vasc Dis. 2001;1:37–43. doi: 10.1177/14746514010010010601. - DOI
    1. Shaw JE, Sicree RA, Zimmet PZ. Global estimates of the prevalence of diabetes for 2010 and 2030. Diabetes Res Clin Pract. 2010;87:4–14. doi: 10.1016/j.diabres.2009.10.007. - DOI - PubMed
    1. Thomas RL, Dunstan F, Luzio SD, Roy Chowdury S, Hale SL, North RV, Gibbins RL, Owens DR. Incidence of diabetic retinopathy in people with type 2 diabetes mellitus attending the diabetic retinopathy screening service for Wales: retrospective analysis. BMJ. 2012;344:e874. doi: 10.1136/bmj.e874. - DOI - PMC - PubMed
    1. Fox CS, Pencina MJ, Meigs JB, Vasan RS, Levitzky YS, D’Agostino RB. Trends in the incidence of type 2 diabetes mellitus from the 1970s to the 1990s. The Framingham Heart Study. Circulation. 2006;113:2814–2918. - PubMed