. 2012 Dec;42(3):622-36.
doi: 10.1007/s12020-012-9717-9. Epub 2012 Jun 14.

Cyclic AMP signaling in bone marrow stromal cells has reciprocal effects on the ability of mesenchymal stem cells to differentiate into mature osteoblasts versus mature adipocytes

Affiliations

Cyclic AMP signaling in bone marrow stromal cells has reciprocal effects on the ability of mesenchymal stem cells to differentiate into mature osteoblasts versus mature adipocytes

Richard Kao et al. Endocrine. 2012 Dec.

Abstract

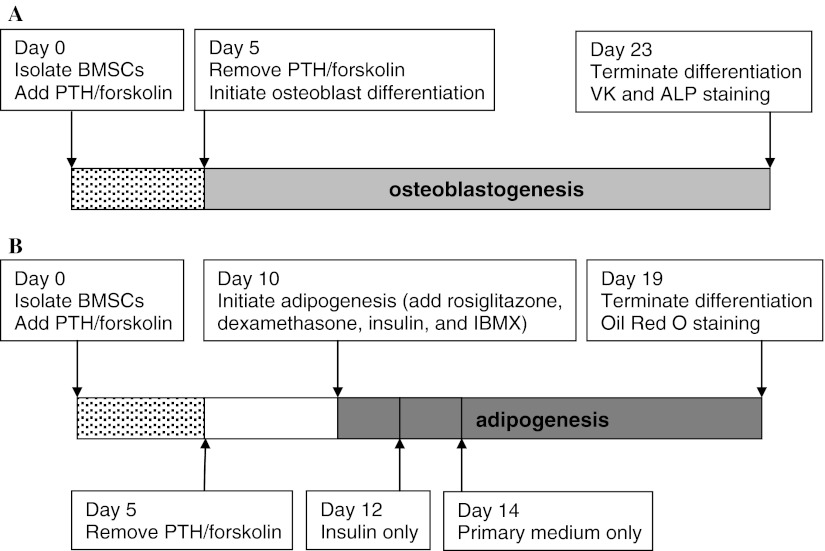
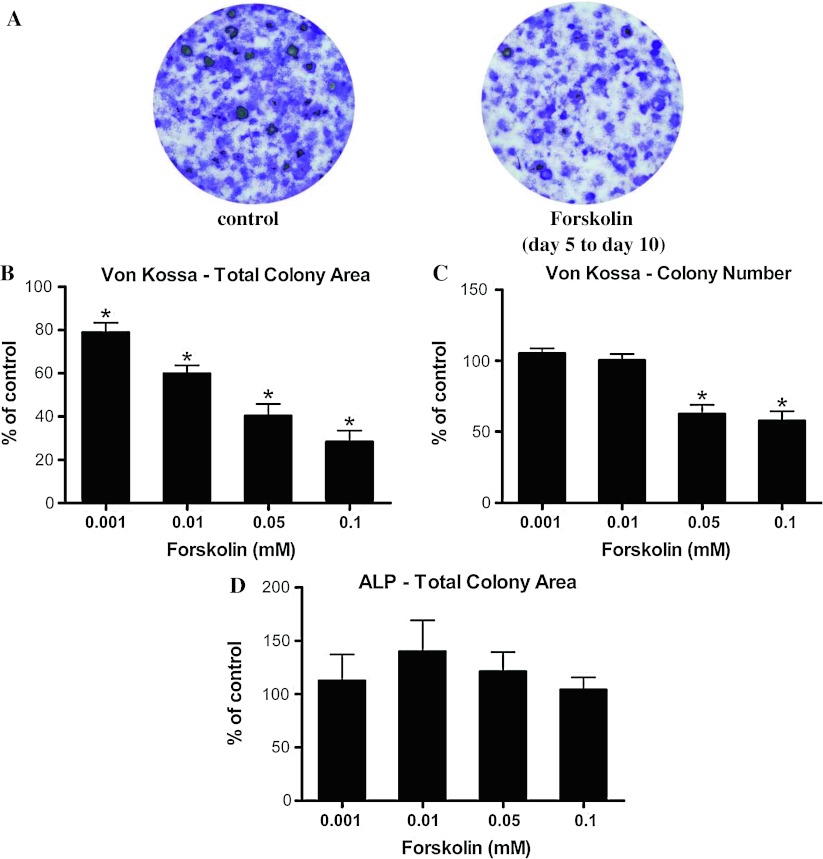
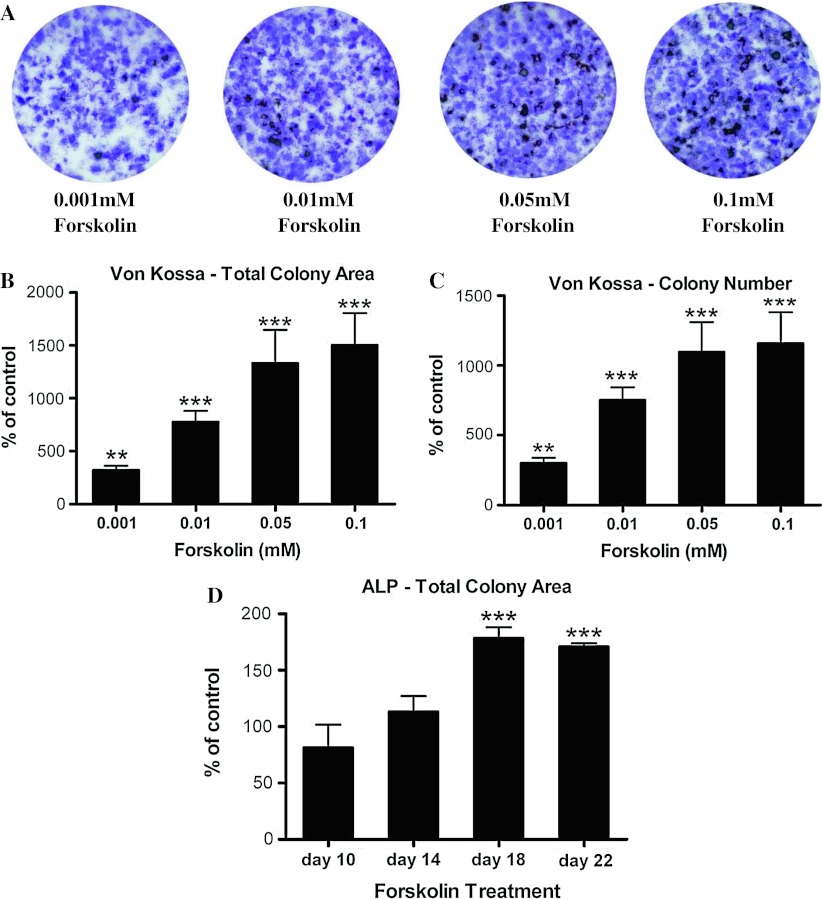
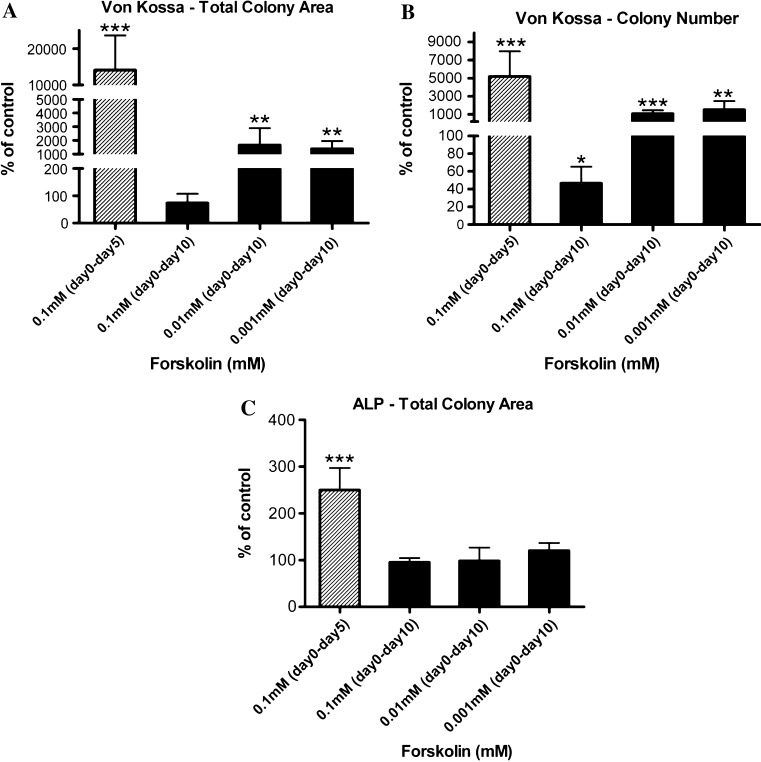
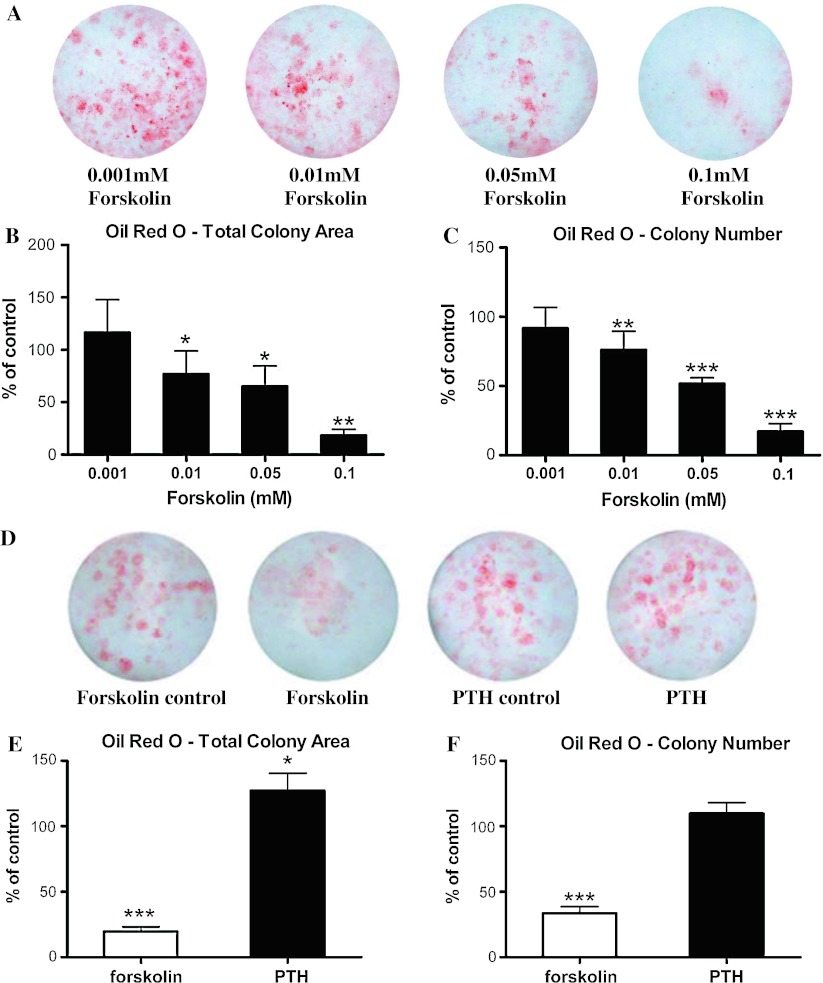
Stimulatory G protein-mediated cAMP signaling is intimately involved in skeletal homeostasis. However, limited information is available on the role of the cAMP signaling in regulating the differentiation of mesenchymal stem cells into mature osteoblasts and adipocytes. To investigate this, we treated primary mouse bone marrow stromal cells (BMSCs) with forskolin to stimulate cAMP signaling and determined the effect on osteoblast and adipocyte differentiation. Exposure of differentiating osteoblasts to forskolin markedly inhibited progression to the late stages of osteoblast differentiation, and this effect was replicated by continuous exposure to PTH. Strikingly, forskolin activation of cAMP signaling in BMSCs conditioned mesenchymal stem cells (MSCs) to undergo increased osteogenic differentiation and decreased adipogenic differentiation. PTH treatment of BMSCs also enhanced subsequent osteogenesis, but promoted an increased adipogenesis as well. Thus, activation of cAMP signaling alters the lineage commitment of MSCs, favoring osteogenesis at the expense of adipogenesis.


Figures

Fig. 1
Fig. 1
In vitro mesenchymal stem cell differentiation protocols to evaluate the effects of PTH and forskolin stimulation of cAMP signal in MSCs on subsequent osteogenesis or adipogenesis. a Mouse BMSCs were freshly isolated from long bones and plated in primary culture medium in the presence of PTH or forskolin and their respective vehicle controls. At day 5, PTH or forskolin was removed and cells were induced to differentiate into osteoblasts. Osteoblastogenesis was allowed to continue until it was terminated on day 23. b BMSCs were freshly isolated and plated in primary medium in the presence of PTH or forskolin and their respective vehicle controls. At day 5, PTH or forskolin was removed, and fresh medium was added to the cells. At day 10, adipogenesis was initiated by the addition of rosiglitazone, dexamethasone, insulin, and IBMX. Differentiation medium was replaced on day 12 with medium containing insulin only. Insulin was removed on day 14 and cells were cultured in primary medium until day 19
Fig. 2
Fig. 2
Long-term exposure to PTH during osteogenesis completely abolished mineralization, but exposure to PTH for five days before initiation of osteogenesis stimulated osteogenesis. a Von Kossa staining showed no mineralized nodules in cultures that were continuously exposed to 10−7 M hPTH [–34] from day 5 to day 23. (Von Kossa-positive mineralized nodules are stained black. Alkaline phosphatase (ALP)-positive areas are stained purple.) b Exposure to PTH from day 0 to day 5 modestly increased both total Von Kossa-stained area and total ALP-positive area. c Total colony area positive for Von Kossa staining and total ALP-positive colony area were quantified as percent of basal level of control. Data are mean ± SEM. *P < 0.05 and ***P < 0.001 vs. control; n = 3. Unfilled bars represent osteoblast cultures that were exposed to PTH from day 5 to day 23. Filled bars represent BMSC cultures that were exposed to PTH from day 0 to day 5 prior to induction of osteogenesis
Fig. 3
Fig. 3
Five-day treatment with forskolin after initiation of osteoblast differentiation diminished osteoblast mineralization. a Exposure to 0.1 mM forskolin immediately after initiation of osteogenesis for 5 days reduced Von Kossa staining of mineralized nodules, b total Von Kossa-positive colony area, and c total Von Kossa-positive colony number. d No changes in ALP-positive total colony area were detected. Data were quantified as percent of basal level of control and represent mean ± SEM. *P < 0.05 vs. vehicle-treated controls; n = 3
Fig. 4
Fig. 4
Treatment of MSCs with forskolin followed by induction of osteoblast differentiation resulted in a dose-dependent increase in osteogenesis. Primary mouse BMSCs were exposed to different concentrations of forskolin for five days before induction of osteoblast differentiation. a Exposure to forskolin during the 5-day period was able to promote more efficient osteogenesis as indicated by increased Von Kossa staining of mineralized nodules at day 23. b Total colony area stained positive for Von Kossa staining and c total Von Kossa-positive colony number were quantified as percent of basal level of control. d Osteoblast differentiation was terminated at day 10, day 14, day 18, and day 22 to detect for ALP activity at different time points of osteoblast differentiation. Treatment of BMSCs with forskolin followed by induction of osteoblast differentiation resulted in an increase in ALP-positive colony area by day 18. ALP activity was quantified as percent of basal level of control. Data are mean ± SEM. **P < 0.01 and ***P < 0.001 vs. vehicle-treated controls; n = 3
Fig. 5
Fig. 5
a Treatment of MSCs with forskolin followed by induction of osteogenesis resulted in upregulated expression of osteoblast marker gene in late stages of osteoblast differentiation. MSCs were exposed to 0.1 mM of forskolin from day 0 to day 5 before induction of osteoblast differentiation. RNA was isolated from day 10, 14, and 18 of osteoblast cultures. Quantitative real-time RT-PCR was carried out to detect changes in marker gene expression as a result of forskolin treatment. Transcript levels were quantified relative to the average of the expression levels of the internal housekeeping genes, L19 and Hprt1. Data are mean ± SEM. *P < 0.05; n = 3. Unfilled bars represent control MSC cultures that were not exposed to forskolin while filled bars represent cultures that were exposed to forskolin from day 0 to day 5 prior to induction of osteogenesis. b ALP gene expression was upregulated, while PPARγ gene expression was downregulated in MSCs following five days of exposure to forskolin. Reverse transcription and real-time qPCR were performed on RNA isolated from MSCs treated with 0.1 mM forskolin or 10−7 M hPTH [–34] and their respective vehicle controls from day 0 to day 5. ALP transcript levels were quantified relative to the average of the expression levels of the internal housekeeping genes, L19 and Hprt1. PPARγ transcript levels were quantified relative to the expression of L19. Data are mean ± SEM. # P < 0.05; n ≥ 3
Fig. 6
Fig. 6
Five-day forskolin-activated cAMP signaling in differentiating osteoblasts could suppress increased mineralization resulting from forskolin-activated cAMP signaling in BMSCs. Primary mouse BMSCs were exposed to different concentrations of forskolin for five days before induction of osteoblast differentiation followed by continued forskolin treatment after induction for further five days. a Continued 0.1 mM forskolin treatment after induction of differentiation reduced total Von Kossa-positive colony area, b Von Kossa-positive colony number but not c total ALP-positive colony area. Data were quantified as percent of basal level of control and represent mean ± SEM. *P < 0.05, **P < 0.01, and ***P < 0.001 vs. vehicle-treated controls; n = 3
Fig. 7
Fig. 7
Treatment of MSCs with forskolin followed by induction of adipogenesis resulted in a dose-dependent decrease in adipogenesis, while treatment of MSCs with PTH followed by induction of adipogenesis resulted in a modest increase in adipogenesis. Mouse BMSCs were exposed to different concentrations of forskolin from day 0 to day 5 before induction of adipogenesis at day 10. a Oil Red O staining of lipid contents of the cell indicated the degree of adipogenesis. b Total colony area stained positive for Oil Red O staining and c total Oil Red O-positive colony number were quantified as percent of basal level of control. Data are mean ± SEM. *P < 0.05, **P < 0.01, and ***P < 0.001; n = 3. Mouse BMSCs were exposed to 0.1 mM of forskolin or 10−7 M of hPTH [–34] from day 0 to day 5 before induction of adipogenesis at day 10. d Oil Red O stained for lipid content of the cell. e Total colony area stained positive for Oil Red O staining and f total colony number stained positive for Oil Red O were quantified as percent of basal level of control. Data are mean ± SEM. *P < 0.05, ***P < 0.001; n = 4
Fig. 8
Fig. 8
a Effects of five-day exposure to forskolin or Wnt3a on Wnt target gene expression in mesenchymal stem cells. MSCs were treated with 0.1 mM of forskolin or 25 ng/ml of Wnt3a and their respective vehicle controls from day 0 to day 5. RNA was isolated on day 5 and subjected to quantitative real-time RT-PCR. Gene expression was quantified relative to the expression of L19. b Treatment of MSCs with Wnt3a followed by induction of osteoblast differentiation resulted in decreased osteogenesis. Primary mouse BMSCs were exposed to 25 ng/ml of Wnt3a for 5 days before induction of osteoblast differentiation. Exposure to Wnt3a during the 5-day period produced less efficient osteogenesis as indicated by reduced total Von Kossa-positive colony area, Von Kossa-positive colony number, and ALP-positive colony area. Von Kossa and ALP staining were quantified as percent of basal level of control. Data are mean ± SEM. *P < 0.05, **P < 0.01, and ***P < 0.001 vs. vehicle-treated controls; n = 3

References

    1. Weinstein LS, et al. Activating mutations of the stimulatory G protein in the McCune–Albright syndrome. N. Engl. J. Med. 1991;325(24):1688–1695. doi: 10.1056/NEJM199112123252403. - DOI - PubMed
    1. Schwindinger WF, Francomano CA, Levine MA. Identification of a mutation in the gene encoding the alpha subunit of the stimulatory G protein of adenylyl cyclase in McCune–Albright syndrome. Proc. Natl. Acad. Sci. USA. 1992;89(11):5152–5156. doi: 10.1073/pnas.89.11.5152. - DOI - PMC - PubMed
    1. Shenker A, et al. Severe endocrine and nonendocrine manifestations of the McCune–Albright syndrome associated with activating mutations of stimulatory G protein GS. J. Pediatr. 1993;123(4):509–518. doi: 10.1016/S0022-3476(05)80943-6. - DOI - PubMed
    1. Malchoff CD, et al. An unusual presentation of McCune–Albright syndrome confirmed by an activating mutation of the Gs alpha-subunit from a bone lesion. J. Clin. Endocrinol. Metab. 1994;78(3):803–806. doi: 10.1210/jc.78.3.803. - DOI - PubMed
    1. Shenker A, et al. An activating Gs alpha mutation is present in fibrous dysplasia of bone in the McCune–Albright syndrome. J. Clin. Endocrinol. Metab. 1994;79(3):750–755. doi: 10.1210/jc.79.3.750. - DOI - PubMed

Publication types

MeSH terms

LinkOut - more resources