. 2012 Aug;159(4):1295-308.
doi: 10.1104/pp.112.194605. Epub 2012 Jun 13.

Structural variants in the soybean genome localize to clusters of biotic stress-response genes

Affiliations

Structural variants in the soybean genome localize to clusters of biotic stress-response genes

Leah K McHale et al. Plant Physiol. 2012 Aug.

Abstract

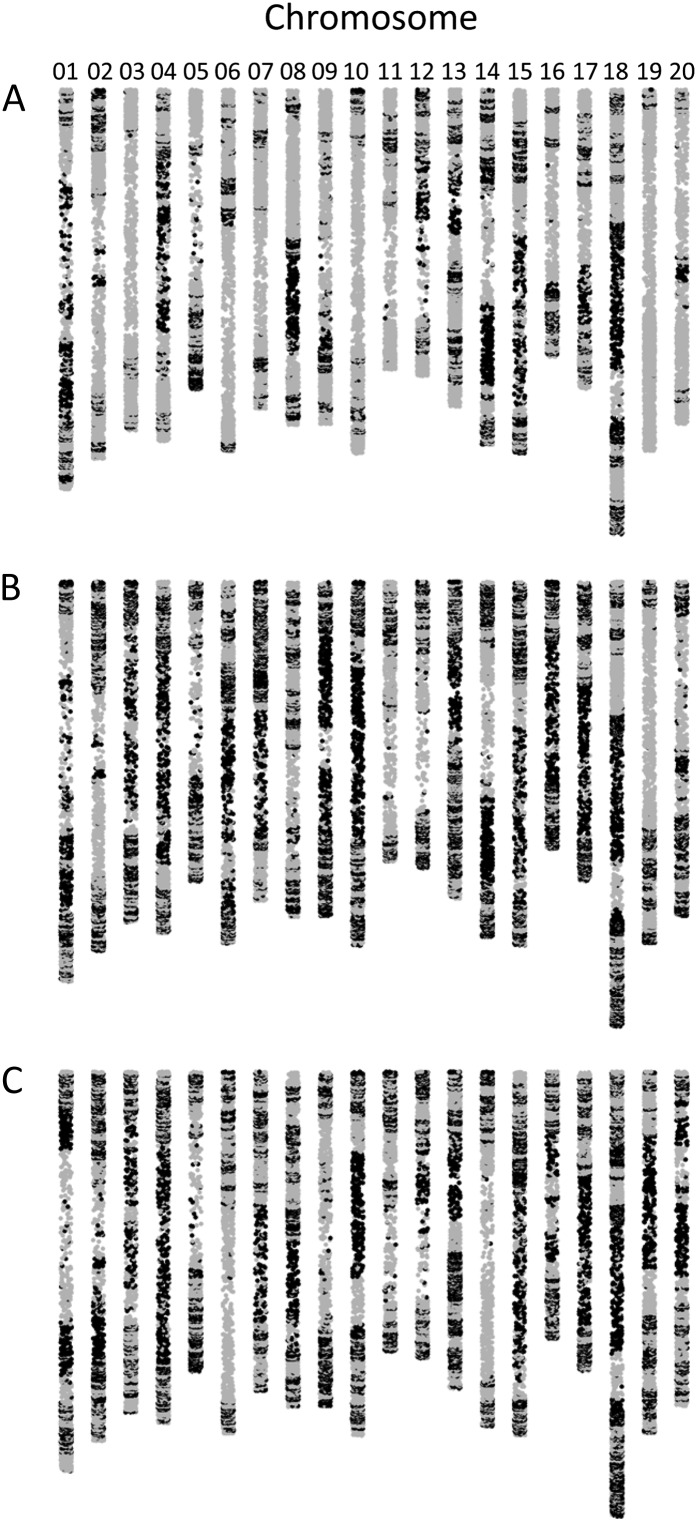
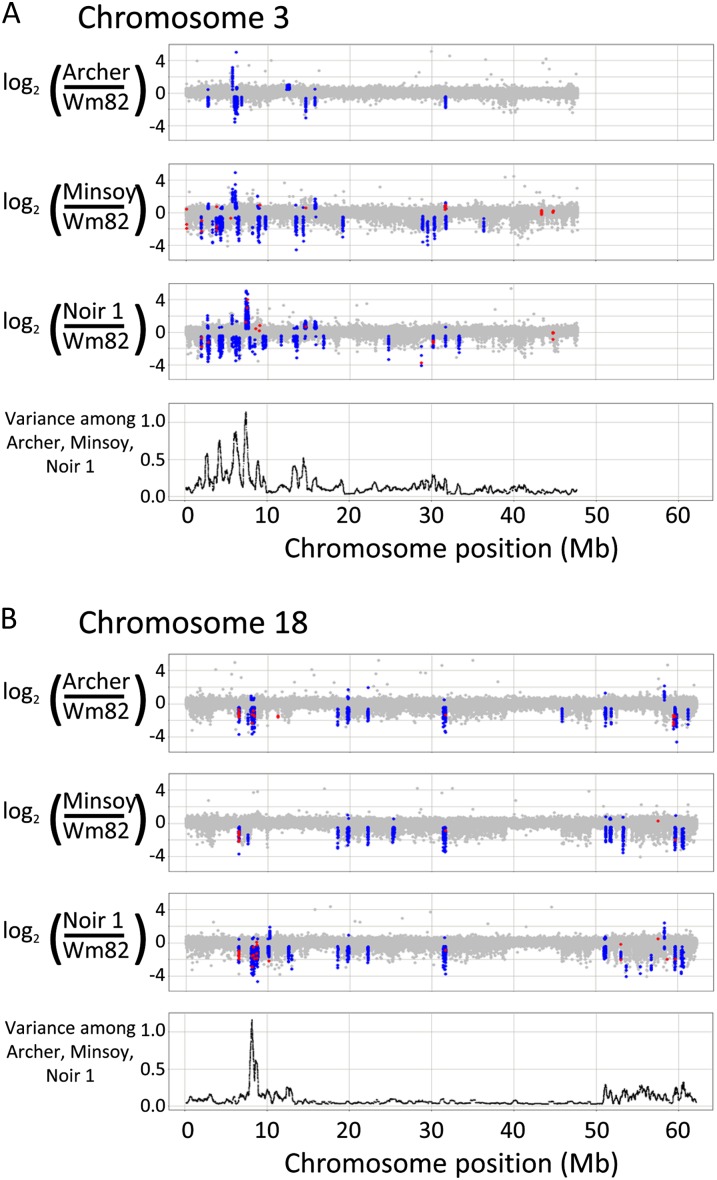
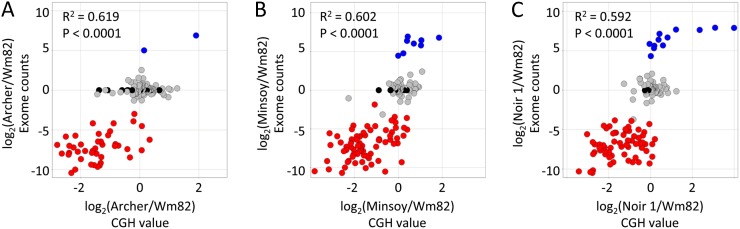
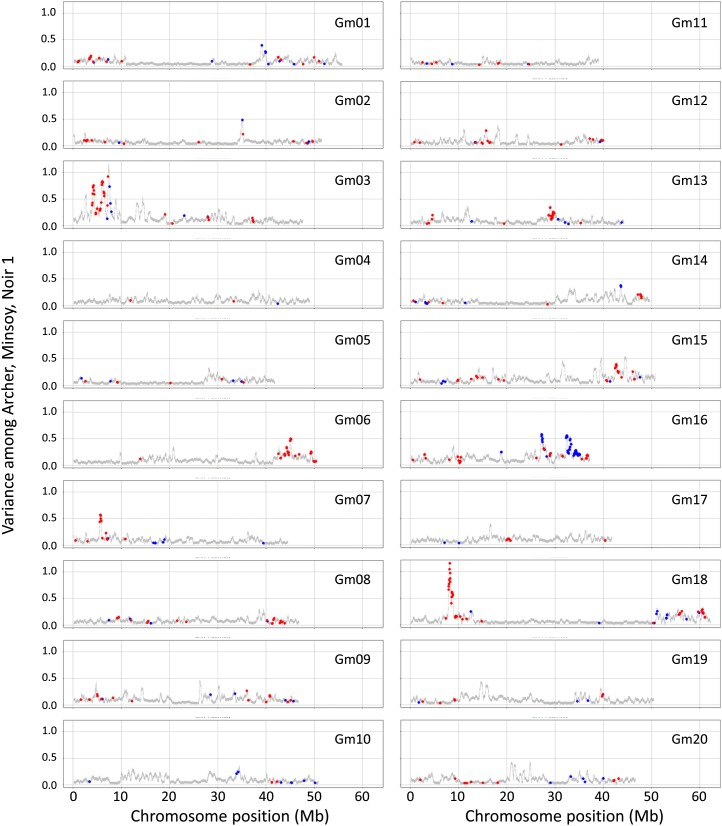
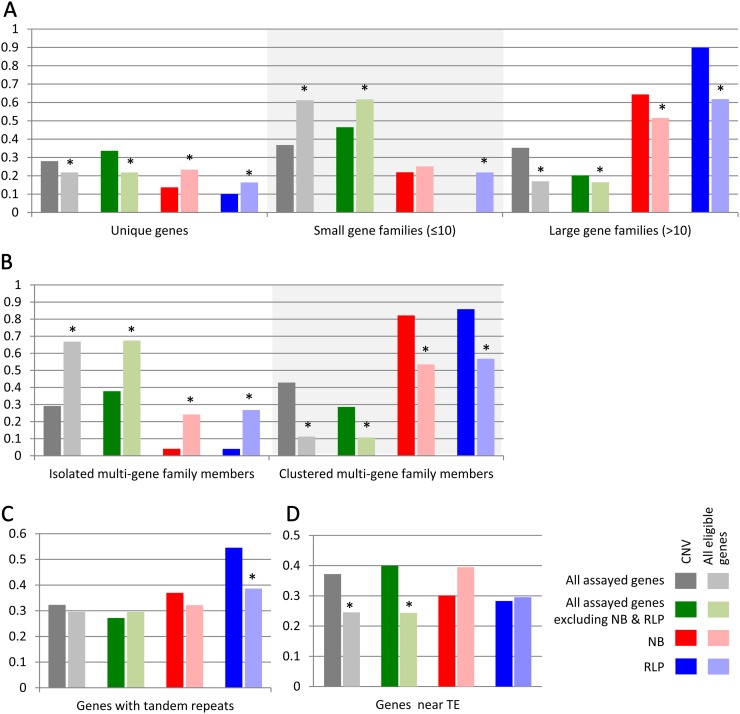
Genome-wide structural and gene content variations are hypothesized to drive important phenotypic variation within a species. Structural and gene content variations were assessed among four soybean (Glycine max) genotypes using array hybridization and targeted resequencing. Many chromosomes exhibited relatively low rates of structural variation (SV) among genotypes. However, several regions exhibited both copy number and presence-absence variation, the most prominent found on chromosomes 3, 6, 7, 16, and 18. Interestingly, the regions most enriched for SV were specifically localized to gene-rich regions that harbor clustered multigene families. The most abundant classes of gene families associated with these regions were the nucleotide-binding and receptor-like protein classes, both of which are important for plant biotic defense. The colocalization of SV with plant defense response signal transduction pathways provides insight into the mechanisms of soybean resistance gene evolution and may inform the development of new approaches to resistance gene cloning.


Figures

Figure 1.
Figure 1.
SNP genotyping reveals regions of conservation and divergence between Wm82 and Archer (A), Wm82 and Minsoy (B), and Wm82 and Noir 1 (C). Gray spots indicate matching SNPs, and black spots indicate polymorphic SNPs between genotypes. The spots are jittered along the x axis to enhance the resolution of the data points.
Figure 2.
Figure 2.
CNV among soybean genotypes on chromosomes 3 (A) and 18 (B). Log2 ratios between each genotype relative to the Wm82 reference are shown. Blue spots indicate probes within significant CNV segments with values beyond threshold. Red spots indicate probes within PAV genes as determined by exome-resequencing analysis. The plots at the bottom of both A and B indicate the average variance (along a sliding window of 250 probes) between the log2 ratios of the Archer, Minsoy, and Noir 1 hybridizations.
Figure 3.
Figure 3.
Cross-validation of CGH and exome-resequencing data for the 133 genes identified as PAV in the exome-resequencing data set. Archer/Wm82 (A), Minsoy/Wm82 (B), and Noir 1/Wm82 (C) log2 ratios based on CGH (x axis) and exome-resequencing counts (y axis) each exhibited significant correlations. Each spot represents one of the 133 genes. Spot coloration is based on the gene presence/absence call in the exome-resequencing data. Red spots indicate genes called absent in Archer (A), Minsoy (B), or Noir 1 (C). Blue spots indicate genes called present in the respective genotype and absent in Wm82. Gray spots indicate genes called present in both the respective genotype and Wm82. Black spots indicate genes called absent in both the respective genotype and Wm82.
Figure 4.
Figure 4.
Colocalization of genome SV within defense gene clusters. Archer, Minsoy, and Noir 1 were each independently hybridized to the CGH microarray, with Wm82 serving as the constant reference. The variance between the log2 ratios of the Archer, Minsoy, and Noir 1 hybridizations was calculated for each probe on the microarray. The average variance along a sliding window of 250 probes is shown on the y axis. Colored spots indicate the probes nearest to the physical positions of genes defined within the NB (red spots) or RLP (blue spots) classes. All soybean NB and RLP gene positions are shown. Regions with high SV tend to localize to the NB- and/or RLP-encoding gene clusters (note the prominent peaks on chromosomes 3, 6, 7, 16, and 18).
Figure 5.
Figure 5.
Enrichment or depletion of CNV in comparison with expectation (all eligible genes) for each gene class. Genes were divided by gene class (e.g. all genes, NB or RLP) as well as groups based on structural characteristics (e.g. size of the gene family). The proportion of genes with a particular structural feature within each gene class is presented. This proportion is presented for genes located within CNV as well as for all genes assayed for CGH comparisons. Significant differences (Fisher’s exact test; P < 0.05) between the proportion of genes within CNV regions and within all eligible genes for each category are indicated by asterisks. A, Proportion of genes that are unique or in small or large gene families. B, Proportion of genes that are clustered or isolated members of multigene families. C, Proportion of genes that contain tandem repeats. D, Proportion of genes within 5 kb of a TE.

References

    1. Altschul SF, Madden TL, Schäffer AA, Zhang J, Zhang Z, Miller W, Lipman DJ. (1997) Gapped BLAST and PSI-BLAST: a new generation of protein database search programs. Nucleic Acids Res 25: 3389–3402 - PMC - PubMed
    1. Ashfield T, Bocian A, Held D, Henk AD, Marek LF, Danesh D, Peñuela S, Meksem K, Lightfoot DA, Young ND, et al. (2003) Genetic and physical localization of the soybean Rpg1-b disease resistance gene reveals a complex locus containing several tightly linked families of NBS-LRR genes. Mol Plant Microbe Interact 16: 817–826 - PubMed
    1. Ashfield T, Egan AN, Pfeil BE, Chen NW, Podicheti R, Ratnaparkhe MB, Ameline-Torregrosa C, Denny R, Cannon S, Doyle JJ, et al. (2012) Evolution of a complex disease resistance gene cluster in diploid Phaseolus and tetraploid Glycine. Plant Physiol 159: 336–354 - PMC - PubMed
    1. Ashfield T, Ong LE, Nobuta K, Schneider CM, Innes RW. (2004) Convergent evolution of disease resistance gene specificity in two flowering plant families. Plant Cell 16: 309–318 - PMC - PubMed
    1. Ashikawa I, Hayashi N, Yamane H, Kanamori H, Wu J, Matsumoto T, Ono K, Yano M. (2008) Two adjacent nucleotide-binding site-leucine-rich repeat class genes are required to confer Pikm-specific rice blast resistance. Genetics 180: 2267–2276 - PMC - PubMed

Publication types

Associated data