. 2012 Apr;3(2):173-80.
doi: 10.1007/s13244-011-0132-1. Epub 2011 Dec 30.

Quantification of iron concentration in the liver by MRI

Affiliations

Quantification of iron concentration in the liver by MRI

José María Alústiza Echeverría et al. Insights Imaging. 2012 Apr.

Abstract

Objective: Measurement of liver iron concentration is a key parameter for the management of patients with primary and secondary haemochromatosis. Magnetic resonance imaging (MRI) has already demonstrated high accuracy to quantify liver iron content. To be able to improve the current management of patients that are found to have iron overload, we need a reproducible, standardised method that is, or can easily be made, widely available.

Methods: This article discusses the different MRI techniques and models to quantify liver iron concentration that are currently available and envisaged for the near future from a realistic perspective.

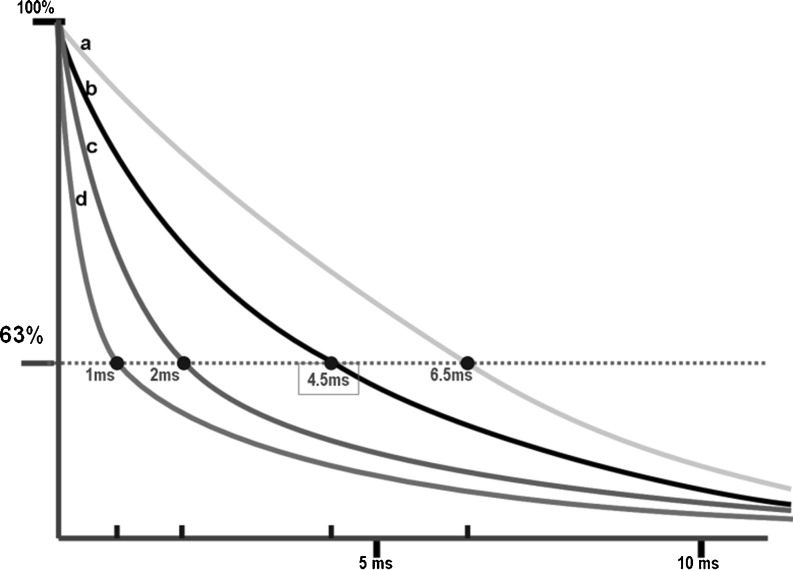
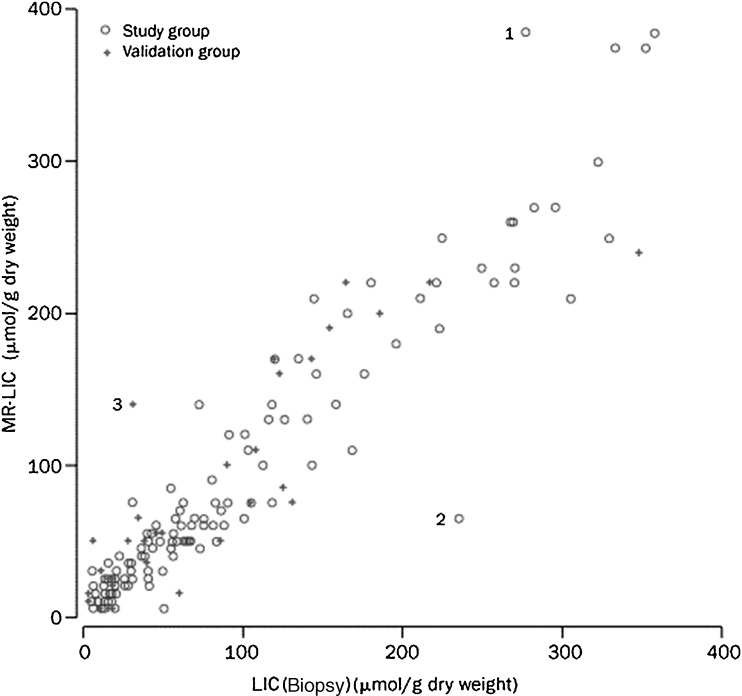
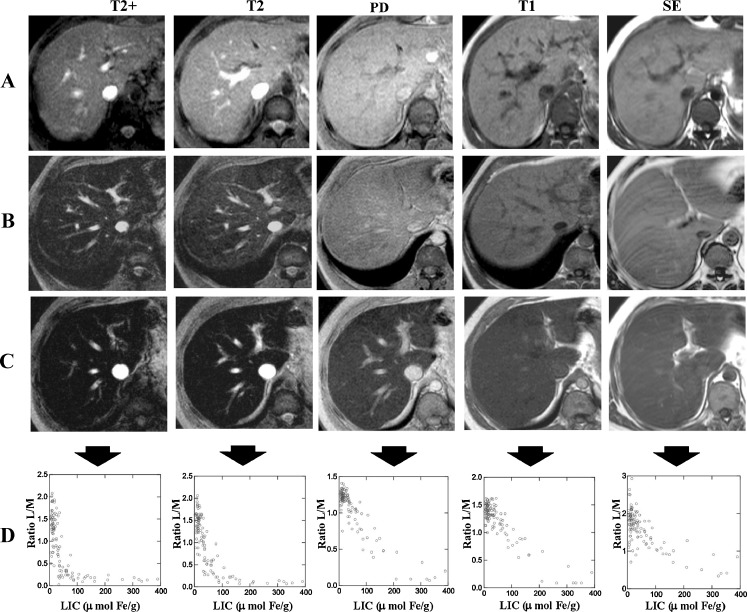
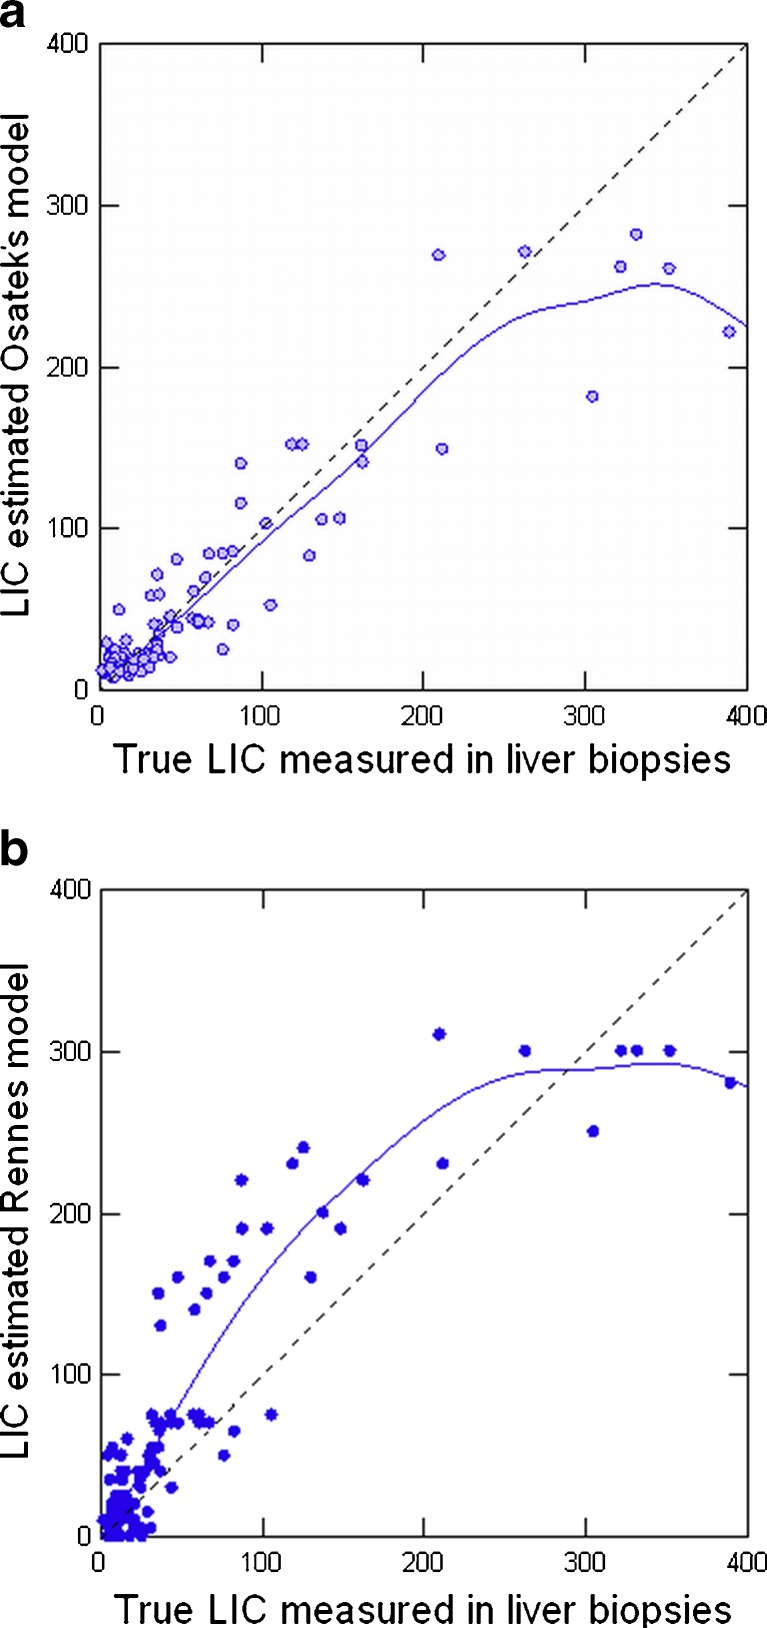
Results: T2 relaxometry methods are more accurate than signal intensity ratio (SIR) methods and they are reproducible but are not yet standardised or widely available. SIR methods, on the other hand, are very specific for all levels of iron overload and, what is more, they are also reproducible, standardised and already widely available.

Conclusions: For these reasons, today, both methods remain necessary while progress is made towards universal standardisation of the relaxometry technique.


Figures

Fig. 1
Fig. 1
T2* transverse relaxation decay curves of signals from the liver in four theoretical examples with different LIC values. a Liver without iron overload, at the lower limit of the normal range (T2* = 6.7 ms). b Liver with slight iron overload (T2* = 4.5 ms). c Liver with high iron overload (T2* = 2 ms). d Liver with very high iron overload (T2* = 1 ms)
Fig. 2
Fig. 2
Multi-echo sequence of two patients with different LICs (TR 21 ms, flip angle 35° (TE first = 1.22 ms, TE interval = 1 ms, 20 echoes). Acquisition time: 14.5 s; matrix 244/145). a Patient without iron overload; isointensity of the liver for all the echoes; T2* =17.4 ms. b Patient with iron overload with loss of the signal from the first echoes; T2* = 2.1 ms
Fig. 3
Fig. 3
R2 and R2* versus LIC measured in liver biopsies. a R2-LIC versus biopsy LIC in 105 patients. “R2 LIC” corresponds to values of LIC estimated from a calibration equation with R2 values (see [8]). b R2* versus biopsy LIC in 21 patients (r = 0.97) (see [11])
Fig. 4
Fig. 4
R2* values calculated with three different MRI methods with respect to the LIC measured in liver biopsies for the same group of patients. The models of Hankins et al and Wood et al have a better correlation than the model of Anderson et al The first echo is 2.3 ms in the Anderson et al model and 1 ms in the other two (see [13])
Fig. 5
Fig. 5
MRI-estimated LIC versus biopsy-measured LIC in 174 patients by the method of Gandon et al (see [24])
Fig. 6
Fig. 6
MRI sequences of the method of Gandon et al in three patients with different levels of LIC. a Patient without iron overload. b Patient with moderate iron overload. c Patient with high iron overload. d Scatterplots of L/M ratio and LIC for each MRI sequence. There is a maximal decrease in liver SI with most T2-weighted sequences. SE spin echo T1 sequence, PD proton density sequence (see [25])
Fig. 7
Fig. 7
MRI-estimated LIC versus biopsy-measured LIC in 112 patients. a By Osatek’s model (r = 0.937). b By the model of Gandon et al (r = 0.887) (see [18])

References

    1. Brittenham GM, Badman DG. Non invasive measurement of iron: report of an NIDDK workshop. Blood. 2003;101:15–19. doi: 10.1182/blood-2002-06-1723. - DOI - PubMed
    1. Pietrangelo A, Deugnier Y, Dooley J, et al. EASL clinical practice guidelines for HFE haemochromatosis. European Association for the Study of the Liver. J Hepatol. 2010;53:3–22. doi: 10.1016/j.jhep.2010.03.001. - DOI - PubMed
    1. Allen KJ, Gurrin LC, Constantine CC, et al. Iron-overload-related disease in HFE hereditary haemochromatosis. N Engl J Med. 2008;358:221–230. doi: 10.1056/NEJMoa073286. - DOI - PubMed
    1. Villeneuve JP, Bilofdeau M, Lepage R, et al. Variability in hepatic iron concentration measurement from needle-biopsy specimens. J Hepatol. 1996;25:172–177. doi: 10.1016/S0168-8278(96)80070-5. - DOI - PubMed
    1. Ambu R, Crisponi G, Sciot R, et al. Uneven hepatic iron and phosphorus distribution in beta-thalassemia. J Hepatol. 1995;23:544–549. doi: 10.1016/0168-8278(95)80060-3. - DOI - PubMed

LinkOut - more resources