. 2012 Jul;139(14):2625-34.
doi: 10.1242/dev.081034. Epub 2012 Jun 13.

Genome-wide characterization of Foxa2 targets reveals upregulation of floor plate genes and repression of ventrolateral genes in midbrain dopaminergic progenitors

Affiliations

Genome-wide characterization of Foxa2 targets reveals upregulation of floor plate genes and repression of ventrolateral genes in midbrain dopaminergic progenitors

Emmanouil Metzakopian et al. Development. 2012 Jul.

Abstract

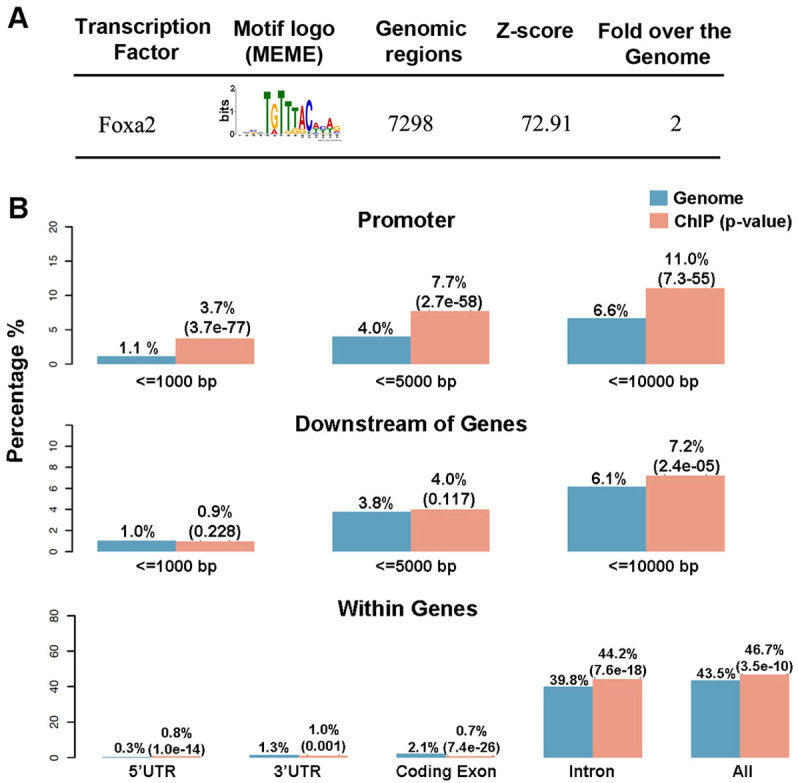
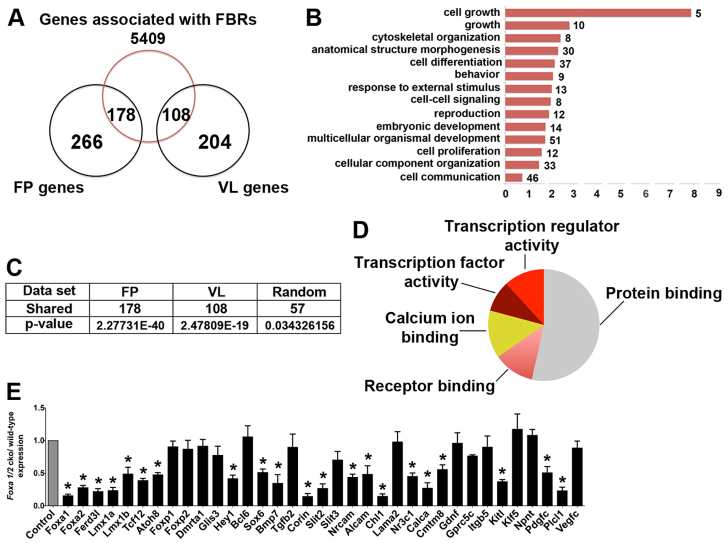
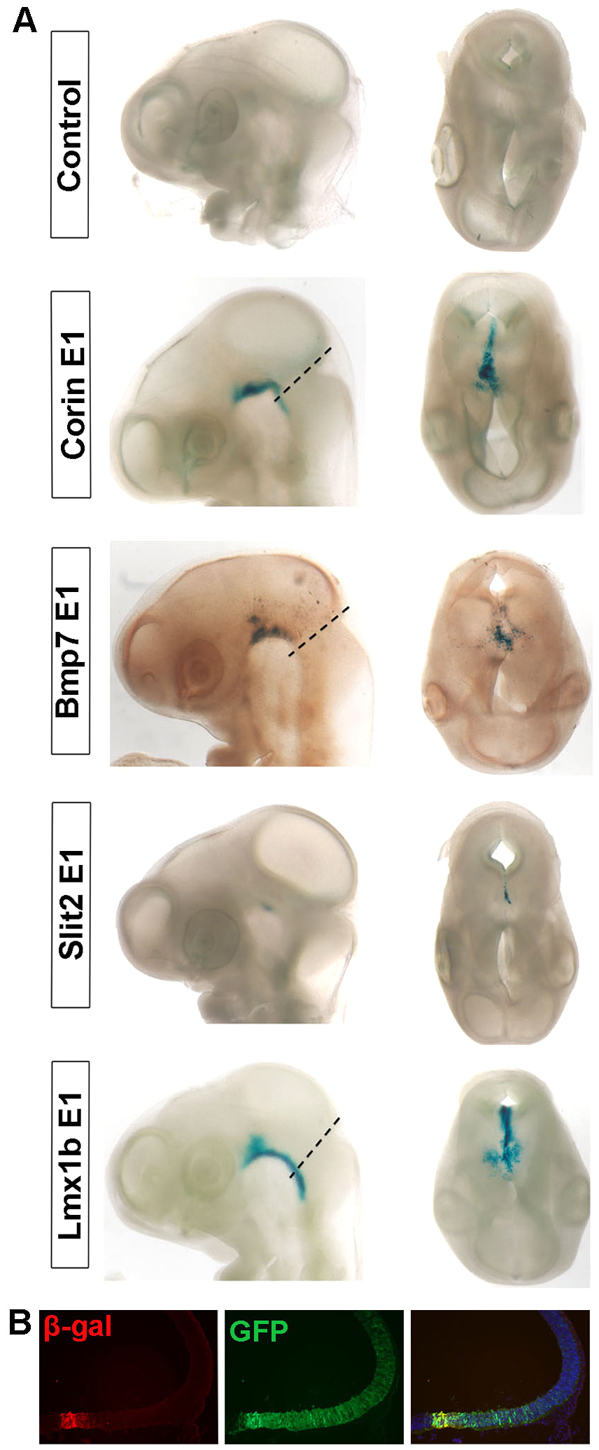
The transcription factors Foxa1 and Foxa2 promote the specification of midbrain dopaminergic (mDA) neurons and the floor plate. Whether their role is direct has remained unclear as they also regulate the expression of Shh, which has similar roles. We characterized the Foxa2 cis-regulatory network by chromatin immunoprecipitation followed by high-throughput sequencing of mDA progenitors. This identified 9160 high-quality Foxa2 binding sites associated with 5409 genes, providing mechanistic insights into Foxa2-mediated positive and negative regulatory events. Foxa2 regulates directly and positively key determinants of mDA neurons, including Lmx1a, Lmx1b, Msx1 and Ferd3l, while negatively inhibiting transcription factors expressed in ventrolateral midbrain such as Helt, Tle4, Otx1, Sox1 and Tal2. Furthermore, Foxa2 negatively regulates extrinsic and intrinsic components of the Shh signaling pathway, possibly by binding to the same enhancer regions of co-regulated genes as Gli1. Foxa2 also regulates the expression of floor plate factors that control axon trajectories around the midline of the embryo, thereby contributing to the axon guidance function of the floor plate. Finally, this study identified multiple Foxa2-regulated enhancers that are active in the floor plate of the midbrain or along the length of the embryo in mouse and chick. This work represents the first comprehensive characterization of Foxa2 targets in mDA progenitors and provides a framework for elaborating gene regulatory networks in a functionally important progenitor population.


Figures

Fig. 1.
Fig. 1.
Chromatin immunoprecipitation of in vitro-differentiated murine mDA progenitors. (A) Peaks of Foxa2 enrichment identified by ChIP-seq are shown for selected mDA progenitor-expressed genes. The plots show the peak heights as numbers of sequenced reads. Arrows indicate peak locations called by MACS. (B) Independent ChIP-qPCR experiments were performed with chromatin prepared from E12.5 ventral midbrain tissue for validation of selected candidate targets, where enrichment is shown as percentage of input (*P<0.05). Multiple peaks within a gene region, corresponding to the list in supplementary material Table S1, are numbered E1 (for Element 1), and so on, from left to right. -ve1, Foxa2 open reading frame (Mavromatakis et al., 2011). Error bars indicate s.e.m.
Fig. 2.
Fig. 2.
Analyses of motifs and peak distribution in Foxa2-bound regions. (A) MEME identified de novo transcription factor binding motifs within 60 bp of the center of Foxa2 peaks. Genomatix results include: (1) the number of peaks that contained the transcription factor binding motif; (2) the Z-score of over-representation against the selected background (randomized sequences); and (3) the over-representation against the mouse genome, which is the fold factor of the number of Foxa2 motifs within the ChIP-seq dataset compared with an equally sized sample of the genome. (B) The distribution and enrichment relative to the genome background of Foxa2 peaks with respect to different gene features. The P-value is given in parenthesis.
Fig. 3.
Fig. 3.
Foxa2 peaks in genes of the Shh pathway. (A) Foxa2 binding sites were observed in genomic regions previously identified as bound by Gli1 (Vokes et al., 2007), including in the genes Ptch1, Nkx2-9, Gli1, Hhip and Foxa2. Peaks found in the Shh and Gli3 genes are also included. (B) ChIP-qPCR experiments performed with chromatin from mouse E12.5 ventral midbrain tissue were used to validate the data (*P<0.05). Error bars indicate s.e.m. -ve1, Foxa2 open reading frame; -ve2, Gli-ve (an upstream region of Gli2) (Mavromatakis et al., 2011).
Fig. 4.
Fig. 4.
Foxa2 directly regulates genes with multiple developmental functions. (A) The overlap between genes associated with Foxa2 binding events and genes expressed predominantly in the floor plate (FP) or the ventrolateral region (VL) of the midbrain of E10.5 mouse embryos. FP and VL data were obtained from Gennet et al. (Gennet et al., 2011). (B) Enrichment of Gene Ontology (GO) terms from GO Slim for biological processes associated with FP-specific Foxa2-bound genes. The number of target genes in each category is shown. (C) The number of Foxa2 target genes in each region with statistical analysis. (D) Enrichment of GO terms for molecular functions (GO Slim) associated with FP-specific Foxa2-bound genes. (E) qRT-PCR analysis of selected FP-specific Foxa2-bound genes using ventral midbrain tissue from E10.5 wild-type and Foxa1/2 cko embryos (*P<0.05). Error bars indicate s.e.m.
Fig. 5.
Fig. 5.
Successful prediction of FP enhancers from Foxa2 binding events in mDA progenitors. (A-E) E10.0-10.5 transgenic mouse embryos expressing lacZ from a minimal promoter and candidate enhancers bound by Foxa2 in the Lmx1a, Lmx1b and Corin genes. (A′-E″) Histological sections through the midbrain (A′-E′) and the spinal cord (A″-E″). (F) Whole-mount lacZ staining of transgenic embryos containing the Lmx1b E1 enhancer with a mutation in the Foxa2 binding site. (G) Multiple species alignment of the Lmx1b E1 enhancer using ClustalW, with the Foxa2 motif indicated by the red box and the nucleotide substitutions in the mutated version of the motif in red. Similar staining in midbrain tissue was observed in at least three transgenic embryos for each of the enhancers illustrated in this figure. Scale bars: 100 μm.
Fig. 6.
Fig. 6.
Screening of candidate enhancer elements bound by Foxa2 in chick embryos. (A) The midbrain neuroepithelium of stage 10 chick embryos was electroporated with selected candidate enhancers in the Lmx1a, Lmx1b, Bmp7, Slit2 and Corin genes cloned in a lacZ reporter construct. A GFP construct was co-electroporated with the test constructs to assess electroporation efficiency and the empty lacZ reporter construct was used as control (not shown). Embryos harvested 48 hours post-electroporation are shown in lateral view (left) and dorsal view (right). Dashed lines indicate midbrain-hindbrain boundary. (B) Coronal section of a chick embryo electroporated with the Lmx1b E1 lacZ construct showing GFP+ electroporated cells in most of the midbrain (green), whereas β-gal expression (red) is restricted to the ventral midbrain. The right-hand image is a merge.
Fig. 7.
Fig. 7.
Inhibition of ventrolateral determinants in the FP of the midbrain. (A-D′) Tle4, Otx1, Sox1 and Tal2 are ectopically expressed in the FP in addition to their normal expression in the dorsal and/or ventrolateral midbrain regions of mouse E10.5 Foxa1/2 cko mutants, as compared with control littermates. (E,E′) No change was observed for Pax3 expression in the dorsal midbrain between Foxa1/2 cko mutants and control littermates.
Fig. 8.
Fig. 8.
Model of the Foxa2-driven regulatory network in the midbrain FP. A model for a Foxa2-driven transcriptional network regulating mDA neuronal and FP specification depicted using standard BioTapestry nomenclature (http://www.biotapestry.org) (Longabaugh et al., 2005). Non-expressed genes are in gray; expressed genes are in black or other colors. Foxa2 targets validated in this study by ChIP-qPCR and expression analysis in mutant embryos are indicated by bold red lines. Other colored broken lines indicate interactions based on other genetic studies in mice or chick (Ono et al., 2010; Andersson et al., 2006a; Yan et al., 2011). Gli-act, Gli activator.

References

    1. Agren M., Kogerman P., Kleman M. I., Wessling M., Toftgard R. (2004). Expression of the PTCH1 tumor suppressor gene is regulated by alternative promoters and a single functional Gli-binding site. Gene 330, 101-114 - PubMed
    1. Andersson E., Jensen J. B., Parmar M., Guillemot F., Bjorklund A. (2006a). Development of the mesencephalic dopaminergic neuron system is compromised in the absence of neurogenin 2. Development 133, 507-516 - PubMed
    1. Andersson E., Tryggvason U., Deng Q., Friling S., Alekseenko Z., Robert B., Perlmann T., Ericson J. (2006b). Identification of intrinsic determinants of midbrain dopamine neurons. Cell 124, 393-405 - PubMed
    1. Ang S. L. (2009). Foxa1 and Foxa2 transcription factors regulate differentiation of midbrain dopaminergic neurons. Adv. Exp. Med. Biol. 651, 58-65 - PubMed
    1. Ang S. L., Rossant J. (1994). HNF-3 beta is essential for node and notochord formation in mouse development. Cell 78, 561-574 - PubMed

Publication types

MeSH terms

LinkOut - more resources