. 2012 Sep;97(9):732-41.
doi: 10.1002/bip.22041.

Nhs: network-based hierarchical segmentation for cryo-electron microscopy density maps

Affiliations

Nhs: network-based hierarchical segmentation for cryo-electron microscopy density maps

Virginia Burger et al. Biopolymers. 2012 Sep.

Abstract

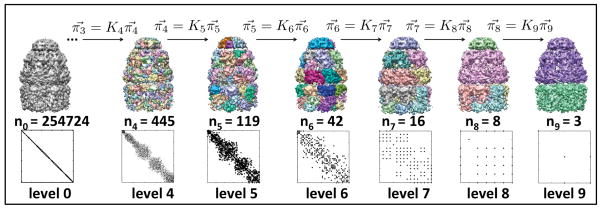
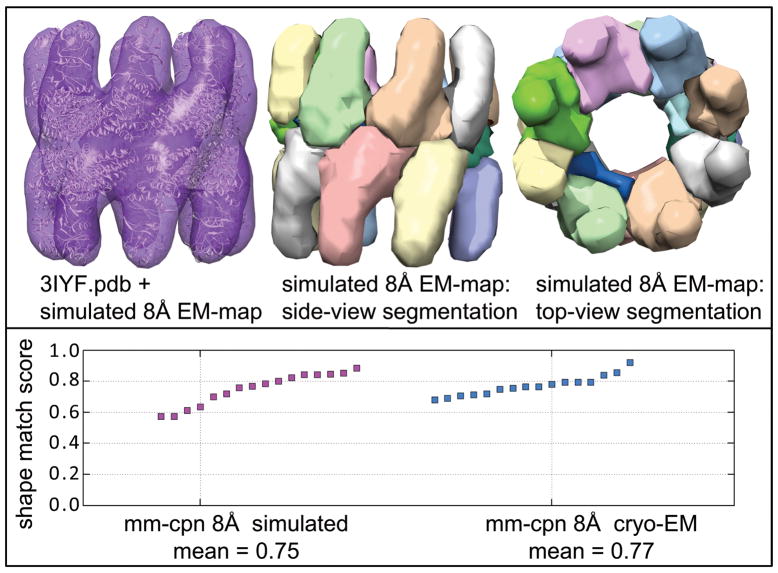
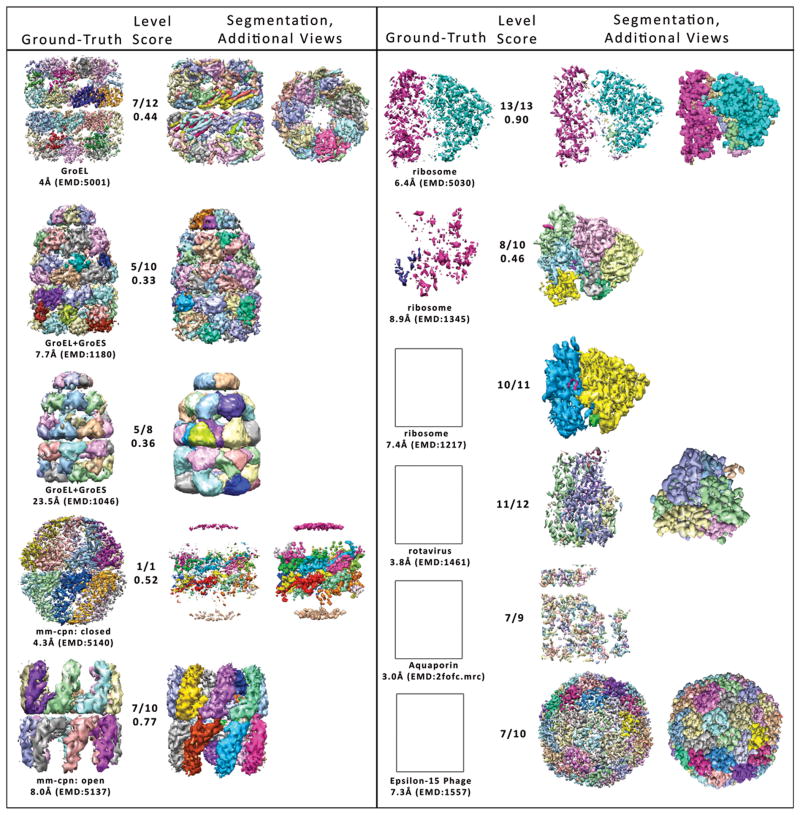
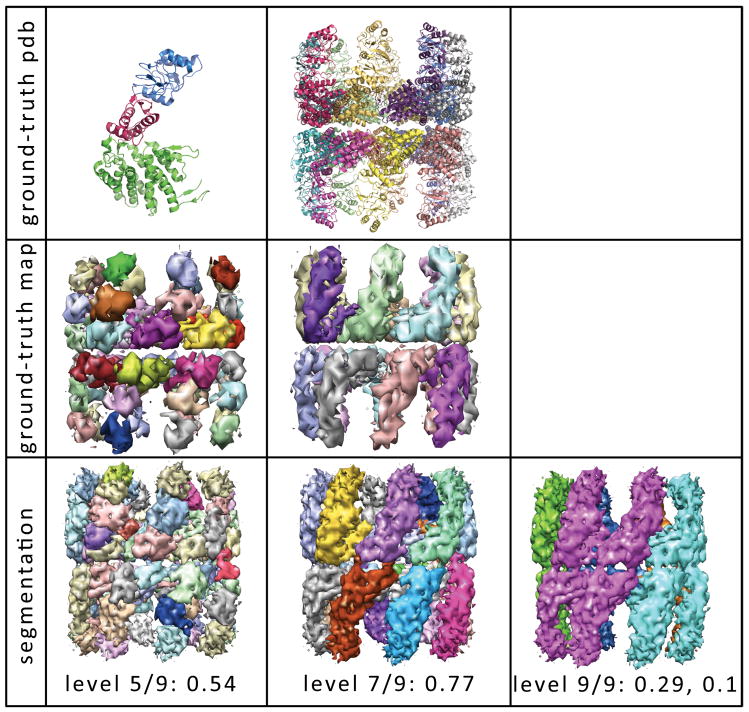
Cryo-electron microscopy (cryo-EM) experiments yield low-resolution (3-30 Å) 3D-density maps of macromolecules. These density maps are segmented to identify structurally distinct proteins, protein domains, and subunits. Such partitioning aids the inference of protein motions and guides fitting of high-resolution atomistic structures. Cryo-EM density map segmentation has traditionally required tedious and subjective manual partitioning or semisupervised computational methods, whereas validation of resulting segmentations has remained an open problem in this field. We introduce a network-based hierarchical segmentation (Nhs) method, that provides a multi-scale partitioning, reflecting local and global clustering, while requiring no user input. This approach models each map as a graph, where map voxels constitute nodes and weighted edges connect neighboring voxels. Nhs initiates Markov diffusion (or random walk) on the weighted graph. As Markov probabilities homogenize through diffusion, an intrinsic segmentation emerges. We validate the segmentations with ground-truth maps based on atomistic models. When implemented on density maps in the 2010 Cryo-EM Modeling Challenge, Nhs efficiently and objectively partitions macromolecules into structurally and functionally relevant subregions at multiple scales.


Figures

Figure 1
Figure 1. Network-based hierarchical segmentation of GroEL+GroES at 7.7Å
The affinity map and cluster assignments are shown for each hierarchy level. The number of nodes in the network is given for each level. Importantly, in level t there are nt nodes, thus the segmented map has nt clusters and the affinity matrix At is (nt × nt). At level 1, each of the 254,724 voxels in the map are assigned to their own cluster, however, the map is shown in gray for visualization purposes. Levels two and three are left out of the diagram due to space considerations.
Figure 2
Figure 2. Segmentation of simulated 8Å cryo-EM-map
An 8Å cryo-EM map was simulated by isotropic smoothing of the Mm-cpn PDB structure: 3IYF.pdb (12,30). In the top panel, the left image shows the PDB structure (white) inside the simulated map. The middle and right images shows the side and top views of the map segmentation at hierarchy level 6/8. All maps are shown at the intensity threshold (τ) at which they were segmented. In the bottom panel, the shape-match score for each of the 16 Mm-cpn chains is shown for the simulated and the experimental 8Å Mm-cpn cryo-EM maps. The mean score is reported for each map below the graph.
Figure 3
Figure 3. Segmentations of Challenge maps
Colored regions correspond to unique clusters. For each map, the hierarchy level with the highest scoring segmentation is shown (third column). In the second column, the hierarchy level is given out of the total number of hierarchy levels for that Nhs segmentation, as well as the shape-match score for this segmentation. In the first column, the ground-truth partitioning of the map, for which the shape-match score was calculated is shown. Ground-truth maps and predicted segmentations are shown at the intensity threshold used for the segmentation. For GroEL at 4Å and Rotavirus, top-views of the segmented map are shown in the fourth column. For Mm-cpn at 4.3Å, Ribosome at 6.8Å, and Epsilon-15 Phage at 7.3Å, the map is shown at a lower intensity threshold for clarity in the fourth column. Figures generated in Matlab and Chimera with TOM Toolbox (26).
Figure 4
Figure 4. Segmentation of the 8Å Mm-cpn map at three hierarchy levels
The ground-truth partitioning of Mm-cpn can be defined structurally at two levels. The first row shows the atomistic partitioning in the PDB structure (3IYF) at the domain level (column one) and the monomer level (column two). In the upper-left hand corner, the apical domain is shown in blue, the intermediate domain in pink, and the equatorial domain in green (12). The second row shows the ground truth map derived from the above atomistic partitioning. In the third row, segmentation of the Mm-cpn map is shown at three hierarchy levels, along with the shape-match score. The first column shows the segmentation at hierarchy level 5 out of 9, which scored highest with respect to the above domain-based ground truth partitioning. The second column show the segmentation at hierarchy level 7, which scored highest with respect to the monomer-based ground truth partitioning. The third column show the segmentation at hierarchy level 9 out of 9, and its scores with respect the domain-based and monomer-based partitionings, respectively.
Figure 5
Figure 5. Segmentation of GroEL+GroES at 23.5 Å at three intensity thresholds, τ
The threshold τ = 0.087 is our computed default threshold for this map. The threshold τ = 0.029 is the contour level recommended for visualization in the EMBD (1046). The first rows shows the resulting segmentation at the hierarchy level scoring highest for the domain-based ground truth partitioning of GroEL+GroES, and the second row shows the resulting segmentation at the hierarchy level scoring highest for the component-based ground truth partitioning of GroEL+GroES. For each segmentation, the hierarchy level out of the total number of levels is given.

References

    1. Ludtke S, Lawson C, Kleywegt G, Berman H, Chiu W. Pacific Symposium on Biocomputing. 2011:369–373. - PMC - PubMed
    1. Chiu W, Baker M, Jiang W, Dougherty M, Schmid M. Structure. 2005;13:363–372. - PubMed
    1. Volkmann N. Methods in Enzymology. 2010;483:31–46. - PubMed
    1. Pintilie G, Zhang J, Chiu W, Gossard D. IEEE NIH Life Sci Syst Appl Workshop; 2009. pp. 44–47. - PMC - PubMed
    1. Pintilie G, Zhang J, Goddard T, Chiu W, Gossard D. Journal of Structural Biology. 2010;170:427–438. - PMC - PubMed

Publication types