

Historical ecology with real numbers: past and present extent and biomass of an imperilled estuarine habitat
- PMID: 22696522
- PMCID: PMC3396889
- DOI: 10.1098/rspb.2012.0313
Historical ecology with real numbers: past and present extent and biomass of an imperilled estuarine habitat
Abstract
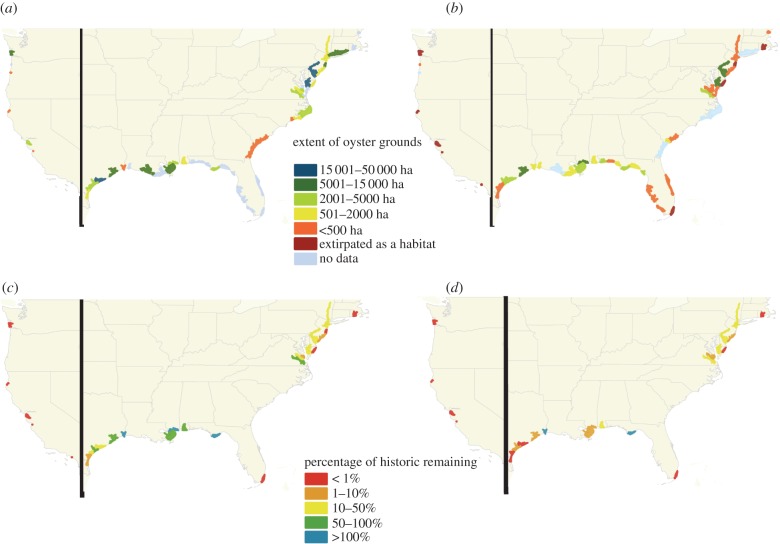
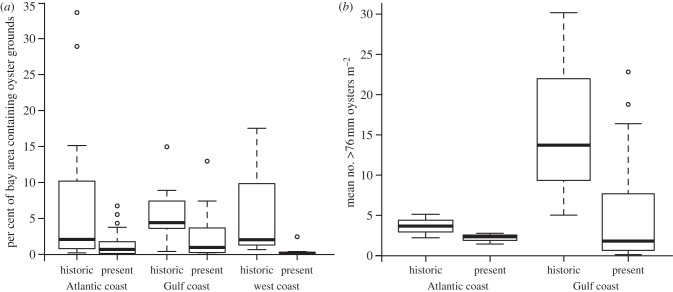
Historic baselines are important in developing our understanding of ecosystems in the face of rapid global change. While a number of studies have sought to determine changes in extent of exploited habitats over historic timescales, few have quantified such changes prior to late twentieth century baselines. Here, we present, to our knowledge, the first ever large-scale quantitative assessment of the extent and biomass of marine habitat-forming species over a 100-year time frame. We examined records of wild native oyster abundance in the United States from a historic, yet already exploited, baseline between 1878 and 1935 (predominantly 1885-1915), and a current baseline between 1968 and 2010 (predominantly 2000-2010). We quantified the extent of oyster grounds in 39 estuaries historically and 51 estuaries from recent times. Data from 24 estuaries allowed comparison of historic to present extent and biomass. We found evidence for a 64 per cent decline in the spatial extent of oyster habitat and an 88 per cent decline in oyster biomass over time. The difference between these two numbers illustrates that current areal extent measures may be masking significant loss of habitat through degradation.
Figures
References
-
- Rick T. C., Erlandson J. M. 2009. Coastal exploitation. Science 952, 325–326 10.1126/science.1178539 (doi:10.1126/science.1178539) - DOI - PubMed
-
- Butchart S. H. M., et al. 2010. Global biodiversity: indicators of recent declines. Science 328, 1164–1168 10.1126/science.1187512 (doi:10.1126/science.1187512) - DOI - PubMed
-
- Sommer A. 1976. Attempt at an assessment of the world's tropical moist forests. Unasylva 28, 5–24
-
- Giri C., Zhu Z., Tieszen L. L., Singh A., Gillette S., Kelmelis J. A. 2007. Mangrove forest distributions and dynamics (1975–2005) of the tsunami-affected region of Asia. J. Biogeogr. 35, 519–528 10.1111/j.1365-2699.2007.01806.x (doi:10.1111/j.1365-2699.2007.01806.x) - DOI
-
- Spalding M., Kainuma M., Collins L. 2010. World atlas of mangroves. Washington, DC: Earthscan
Publication types
MeSH terms
LinkOut - more resources
Full Text Sources
Other Literature Sources
Miscellaneous