. 2012 Aug;23(15):2993-3007.
doi: 10.1091/mbc.E12-03-0232. Epub 2012 Jun 13.

Perturbation-based analysis and modeling of combinatorial regulation in the yeast sulfur assimilation pathway

Affiliations

Perturbation-based analysis and modeling of combinatorial regulation in the yeast sulfur assimilation pathway

R Scott McIsaac et al. Mol Biol Cell. 2012 Aug.

Abstract

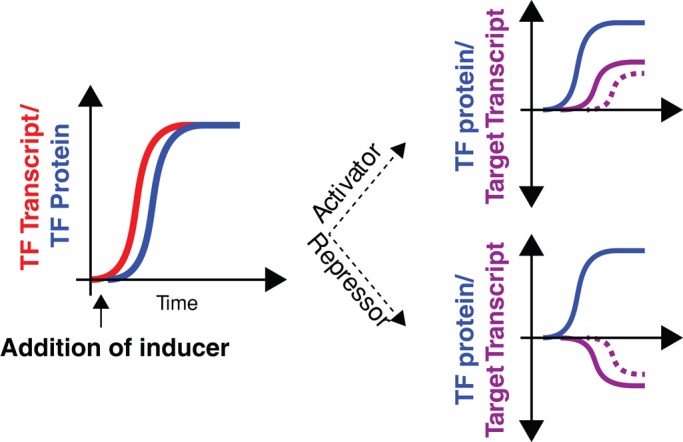
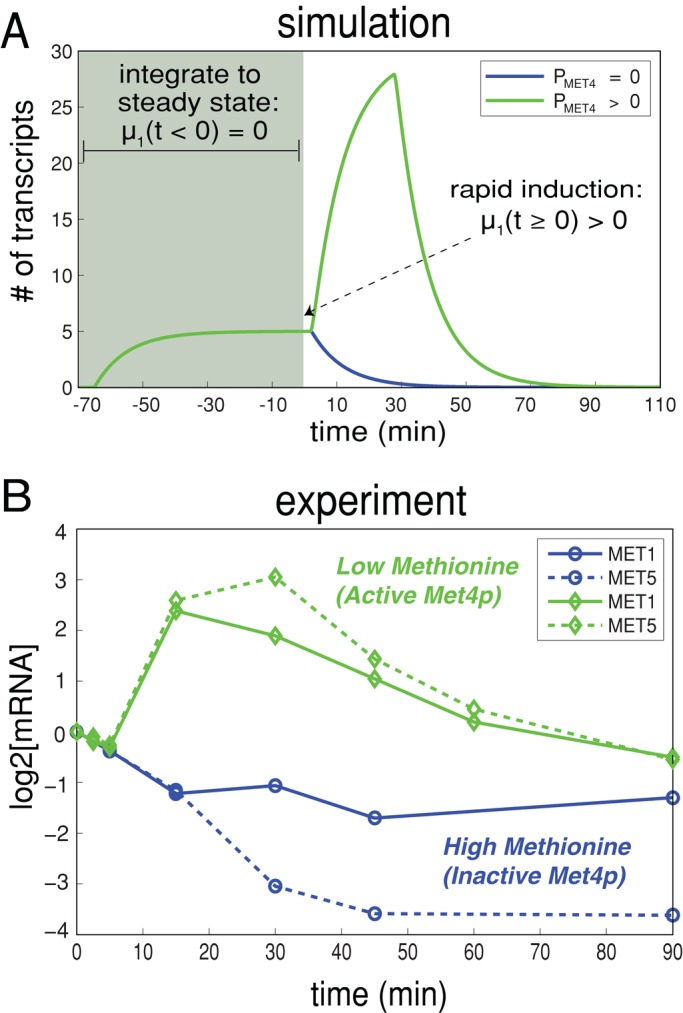
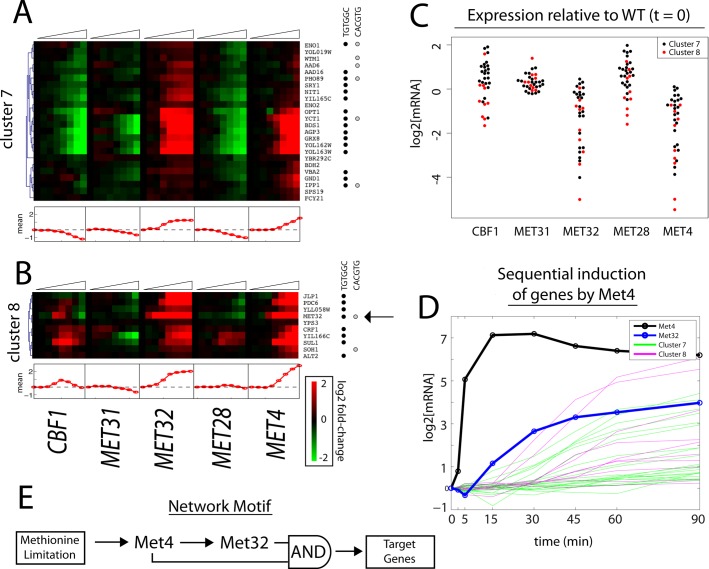
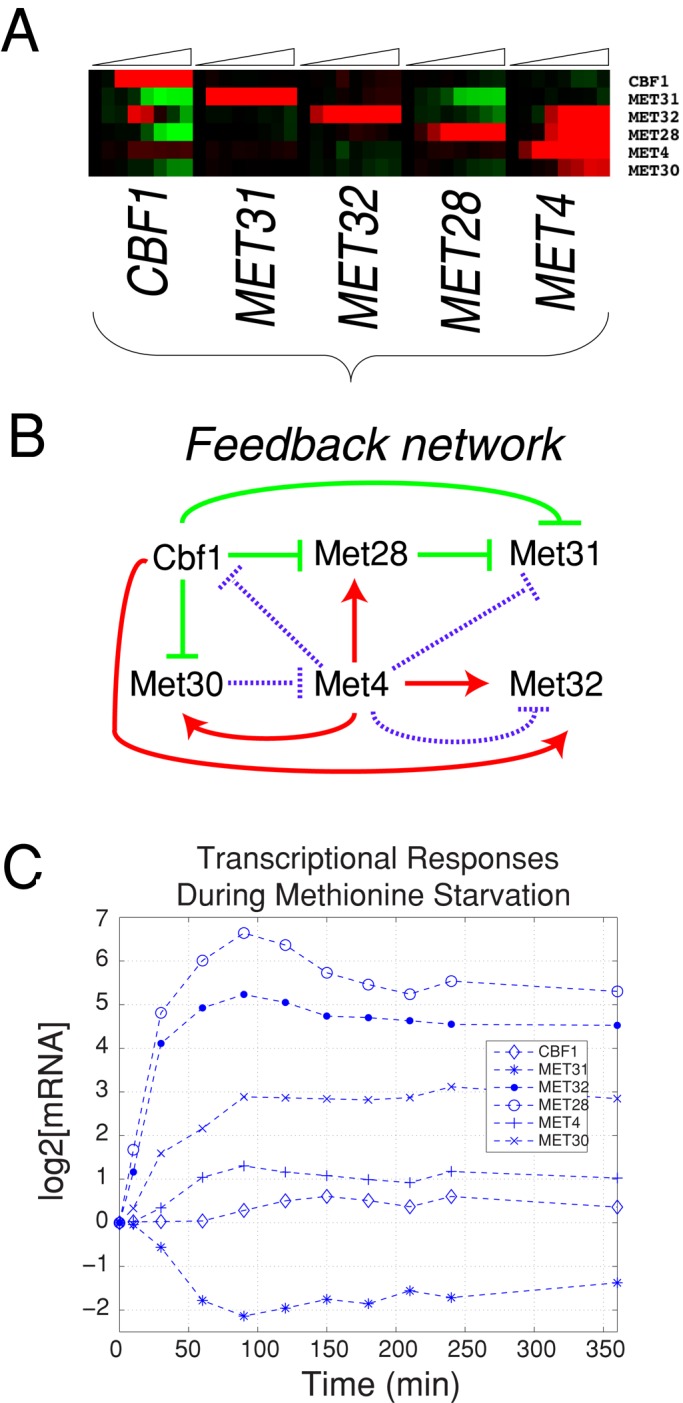
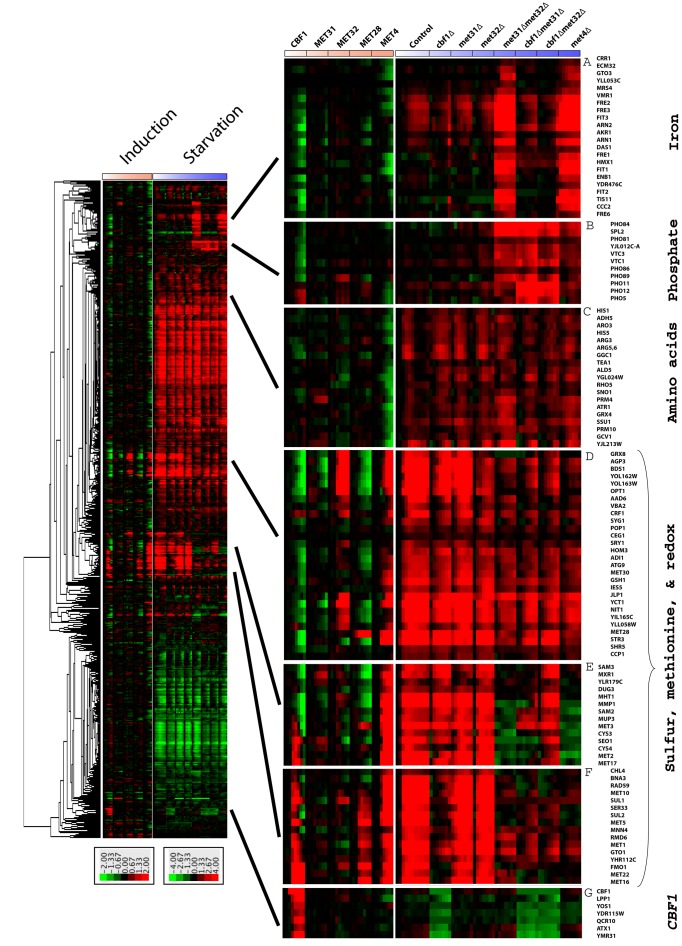
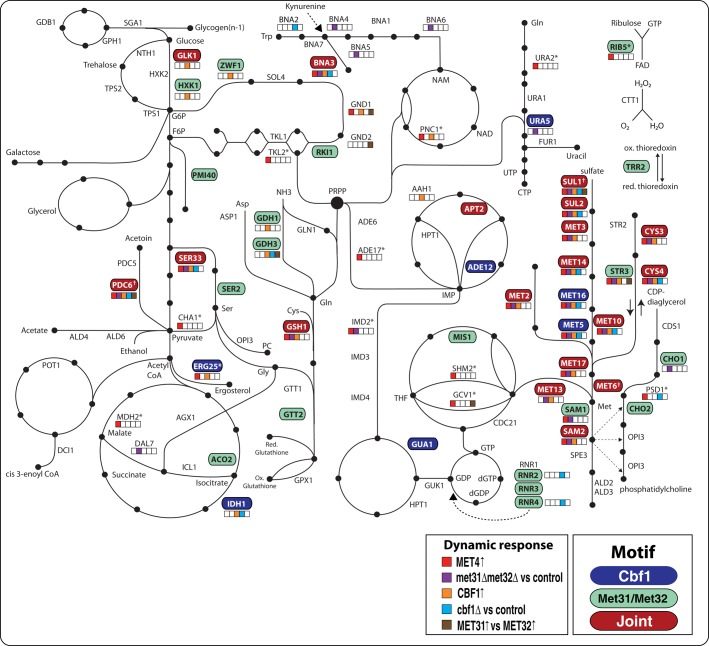
In yeast, the pathways of sulfur assimilation are combinatorially controlled by five transcriptional regulators (three DNA-binding proteins [Met31p, Met32p, and Cbf1p], an activator [Met4p], and a cofactor [Met28p]) and a ubiquitin ligase subunit (Met30p). This regulatory system exerts combinatorial control not only over sulfur assimilation and methionine biosynthesis, but also on many other physiological functions in the cell. Recently we characterized a gene induction system that, upon the addition of an inducer, results in near-immediate transcription of a gene of interest under physiological conditions. We used this to perturb levels of single transcription factors during steady-state growth in chemostats, which facilitated distinction of direct from indirect effects of individual factors dynamically through quantification of the subsequent changes in genome-wide patterns of gene expression. We were able to show directly that Cbf1p acts sometimes as a repressor and sometimes as an activator. We also found circumstances in which Met31p/Met32p function as repressors, as well as those in which they function as activators. We elucidated and numerically modeled feedback relationships among the regulators, notably feedforward regulation of Met32p (but not Met31p) by Met4p that generates dynamic differences in abundance that can account for the differences in function of these two proteins despite their identical binding sites.


Figures

FIGURE 1:
FIGURE 1:
Schematic of TF induction experiments. Before the addition of the inducer β-estradiol to the culture medium, PGAL1-TF alleles are not expressed. Following inducer addition, TF transcript is rapidly made within 5 min (red). Following translation, the TF (blue) can act as either an activator or a repressor in a direct (solid line, purple) or indirect (dashed line, purple) manner.
FIGURE 2:
FIGURE 2:
Gene expression analysis. Data from CBF1, MET31, MET32, MET28, MET4, and GEV-only (control) induction experiments (triangles above the heatmap represent time in the individual experiments). Lowly expressed genes were first removed from the data set, leaving 756 genes for analysis. We removed expression due to the GEV gene expression system by performing an SVD of the control (strain DBY12142) time course and projecting out the variation in the direction of the eigenarrays (i.e., the left eigenvectors of the SVD decomposition). After the control signal was removed, the data were hierarchically clustered. Particular expression clusters are numbered to the right and marked with colored stripes. The cluster marked with an asterisk contains mating genes: the strain used for Met31p induction is MATa, whereas all other strains are MATα. Promoters (−1 to −800 base pairs from the ATG) of genes in the nine clusters were obtained from the RSAT database (Thomas-Chollier et al., 2008). The presence and variation of Met31p/Met32p and Cbf1p core motifs within these promoters were determined using the MEME algorithm.
FIGURE 3:
FIGURE 3:
Singular value decomposition (SVD) of mean-centered gene expression data. (A) Forty eigengenes. (B) Information content of eigengenes. (C) The eigenexpression of the three most significant eigengenes.
FIGURE 4:
FIGURE 4:
Cbf1p is an activator and a repressor. Heatmaps of gene expression clusters 5 (A), 9 (B), and 3 (C). Below each heatmap is the mean expression trace for the cluster. The presence of the Met31p/Met32p core motif (black dot) or Cbf1p core motif (gray dot) in a particular gene's promoter is denoted to the right.
FIGURE 5:
FIGURE 5:
Simulations of parabolic transcriptional responses. (A) Simulations of cofactor induction where there are either no activating proteins (PMET4 = 0) or a limiting number of activating proteins (PMET4 > 0). The plot shows the response of target gene transcript (MTARGET), whose dynamics are described by Eq. 5, in response to induction of the cofactor. In the absence of activators, the cofactor (PCBF1) is by default a direct transcriptional repressor (blue line). In the presence of a limiting number of activators, gene expression is first stimulated before being repressed (green). (B) The experimentally determined transcriptional response of MET1 and MET5 in response to Cbf1p induction under methionine limitation (excess phosphate) or phosphate limitation (excess methionine).
FIGURE 6:
FIGURE 6:
Met4p and Met32p exhibit feedforward regulation. (A, B) Heatmaps of gene expression clusters 7 (A) and 8 (B). (C) Expression levels before TF induction relative to control (DBY12142) mRNA levels. (D) Expression of genes in clusters 7 and 8 in response to Met4p induction: MET4 (black line); MET32 (blue line); cluster 7 genes (green); cluster 8 genes (pink). (E) Network motif of genes in clusters 7 and 8.
FIGURE 7:
FIGURE 7:
Interaction network of Met pathway regulators. (A) Heatmap of the transcriptional responses of CBF1, MET31, MET32, MET28, MET4, and MET30 from induction data in Figure 2. (B) Wiring diagram of interactions among factors. Stimulation of transcription is shown in red, and repression is shown in green. Purple indicates posttranslational feedback between either SCFMet30 and Met4p or Met4p-mediated recruitment of cofactor proteins to SCFMet30 as discussed in the text and in Ouni et al. (2010). (C) Transcriptional responses of Met TFs in met6∆ cells starved for methionine as described in Petti et al. (2012).
FIGURE 8:
FIGURE 8:
Combined cluster of genome-wide expression data from induction and starvation experiments. Induction data from Figure 2 and expression data from deletions (Petti et al., 2012) for the same genes were combined and then hierarchically clustered (left). All strains are met6∆. Several clusters displaying functional enrichment are shown to the right along with the gene names. The most enriched processes in the different clusters based on GO are (A) Iron Ion Homeostasis (p = 7.36e-22), (B) Polyphosphate Metabolic Process (p = 2.38e-08), (C) Carboxylic Acid Metabolic Process (p = 2.3e-04), (D) Sulfur Compound Metabolic Process (p = 2.12e-10), (E) Sulfur Amino Acid Metabolic Process (p = 7.37e-11), (F) Sulfate Assimilation (p = 8.65e-10), and (G) None.
FIGURE 9:
FIGURE 9:
Systems-level regulation of metabolic genes by Met TFs. The schematic represents an overview of yeast metabolism. Genes are first colored according to their promoter type. A promoter can contain a Cbf1p motif (blue), a Met31p/Met32p motif (green), joint (red), or neither (no color). Motifs were mapped to promoters using the MAST algorithm. Second, genes that have expression changes in response to several different perturbations are marked with colored boxes. Significant responses to Met4p or Cbf1p induction are marked in red and orange, respectively, and significant differences between met31∆met32∆/control or cbf1∆/control experiments are marked in purple and cyan, respectively. Finally, significant differences in expression in response to induction of Met31p and Met32p are marked in brown. Significance was determined using linear regression and template matching as described in Materials and Methods. Genes repressed by Met4p are marked with an asterisk. While MET6 is a joint target, it is deleted in all strains (marked by a dagger). In addition, SUL1 and PDC6 are marked with a dagger because MAST did not detect a Cbf1p-binding site in the promoter of either gene. However, it was previously shown that the promoters of these genes each contain a noncanonical Cbf1p-binding site (Cormier et al., 2010).

References

    1. Alter O, Brown PO, Botstein D. Singular value decomposition for genome-wide expression data processing and modeling. Proc Natl Acad Sci USA. 2000;97:10101–10106. - PMC - PubMed
    1. Bailey TL, Elkan C. Fitting a mixture model by expectation maximization to discover motifs in biopolymers. Proc Int Conf Intell Syst Mol Biol. 1994;2:28–36. - PubMed
    1. Berezhkovskii AM, Sample C, Shvartsman SY. Formation of morphogen gradients: local accumulation time. Phys Rev E Stat Nonlin Soft Matter Phys. 2011;83:051906. - PMC - PubMed
    1. Blaiseau PL, Isnard AD, SurdinKerjan Y, Thomas D. Met31p and Met32p, two related zinc finger proteins, are involved in transcriptional regulation of yeast sulfur amino acid metabolism. Mol Cell Biol. 1997;17:3640–3648. - PMC - PubMed
    1. Blaiseau PL, Thomas D. Multiple transcriptional activation complexes tether the yeast activator Met4 to DNA. EMBO J. 1998;17:6327–6336. - PMC - PubMed

Publication types

MeSH terms

Substances