. 2012 Jun 14:13:239.
doi: 10.1186/1471-2164-13-239.

Yeast glucose pathways converge on the transcriptional regulation of trehalose biosynthesis

Affiliations

Yeast glucose pathways converge on the transcriptional regulation of trehalose biosynthesis

Eva Apweiler et al. BMC Genomics. .

Abstract

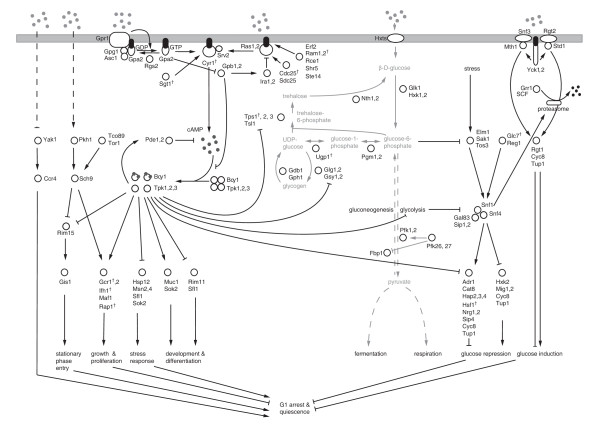
Background: Cellular glucose availability is crucial for the functioning of most biological processes. Our understanding of the glucose regulatory system has been greatly advanced by studying the model organism Saccharomyces cerevisiae, but many aspects of this system remain elusive. To understand the organisation of the glucose regulatory system, we analysed 91 deletion mutants of the different glucose signalling and metabolic pathways in Saccharomyces cerevisiae using DNA microarrays.

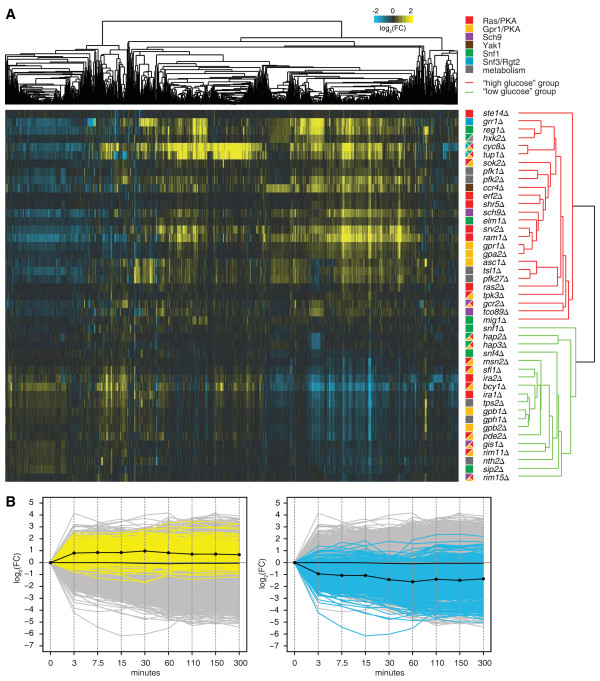
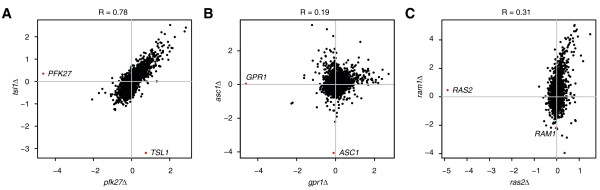
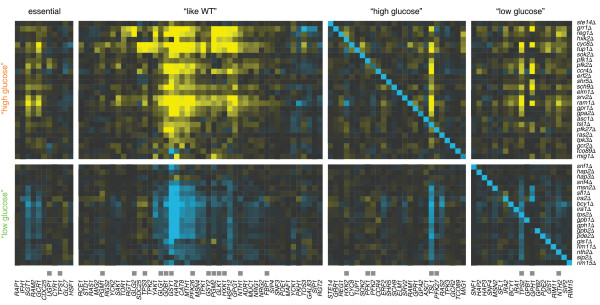
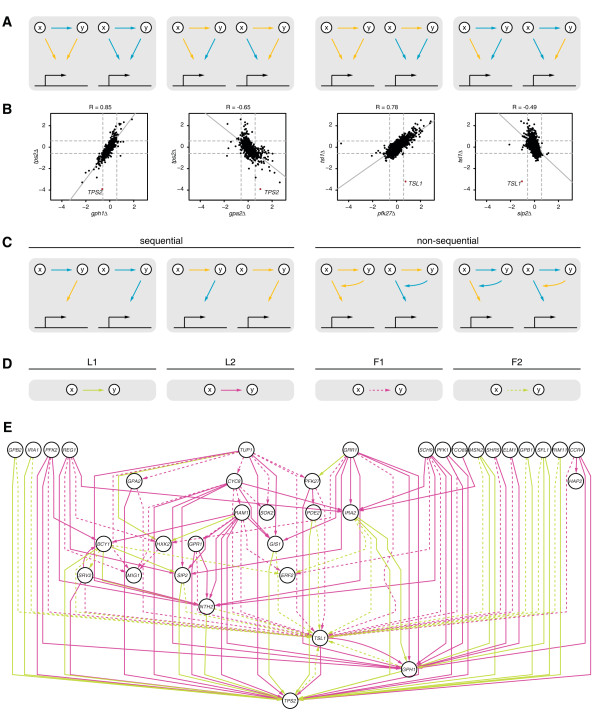
Results: In general, the mutations do not induce pathway-specific transcriptional responses. Instead, one main transcriptional response is discerned, which varies in direction to mimic either a high or a low glucose response. Detailed analysis uncovers established and new relationships within and between individual pathways and their members. In contrast to signalling components, metabolic components of the glucose regulatory system are transcriptionally more frequently affected. A new network approach is applied that exposes the hierarchical organisation of the glucose regulatory system.

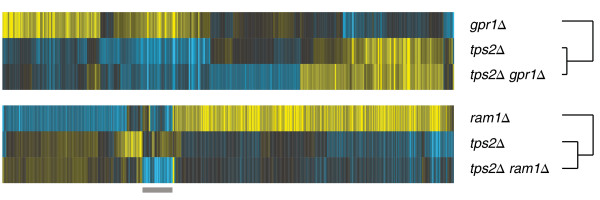
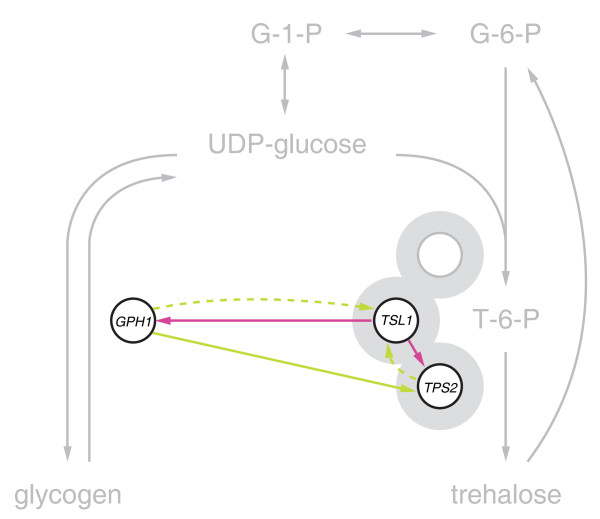
Conclusions: The tight interconnection between the different pathways of the glucose regulatory system is reflected by the main transcriptional response observed. Tps2 and Tsl1, two enzymes involved in the biosynthesis of the storage carbohydrate trehalose, are predicted to be the most downstream transcriptional components. Epistasis analysis of tps2Δ double mutants supports this prediction. Although based on transcriptional changes only, these results suggest that all changes in perceived glucose levels ultimately lead to a shift in trehalose biosynthesis.


Figures

Figure 1
Figure 1
An overview of the yeast glucose signalling and metabolic pathways. Signalling events are indicated in solid black, metabolic reactions in solid grey lines. Dashed black lines imply glucose signals activating the signalling components, dashed grey lines summarise metabolic reactions, e.g. glycolysis and gluconeogenesis. The metabolic pathways synthesising the storage carbohydrates glycogen and trehalose are depicted in detail. indicates that the deletion mutant is lethal.
Figure 2
Figure 2
Transcriptional response mimicking either a high or a low glucose response. (A) Unsupervised hierarchical cluster diagram of all deletion mutants with gene expression changes differing from WT, i.e. twelve or more significant transcriptional changes, and all transcripts changing significantly in at least one of these mutants (p < 0.01, FC > 1.7). The dendrograms indicate relationships between transcripts (top) and mutants (right). The latter is colour-coded according to whether the mutants are part of the “high glucose” (red) or “low glucose” group (green). FC is indicated by the colour scale, with yellow for upregulation, blue for downregulation, and black for no change, versus the average WT. (B) Line graph of a time-course experiment in which glucose-depleted WT cells were inoculated into fresh media (SC, supplemented with 2% glucose) and their subsequent transcriptional output was monitored over a period of five hours. All transcripts differentially expressed between the “high glucose” and “low glucose” groups were split according to whether they were up- (left panel, yellow) or downregulated (right panel, blue) in the “low glucose” group. The average expression of the differentially expressed transcripts is indicated in black; all other transcripts are shown in grey.
Figure 3
Figure 3
Relationships exposed through gene expression profiling. Transcript changes (FC) of two different deletion mutants are plotted against each other. Red dots indicate the deleted genes. (A) Transcript changes of the pfk27Δ and tsl1Δ mutants are highly correlated. (B) Transcriptional changes of the asc1Δ mutant are not negatively correlated to those of the gpr1Δ mutant suggesting that Asc1 does not inhibit Gpr1. (C) The deletion of RAM1 results in many more transcriptional changes than the deletion of RAS2. RAS1 is not shown as its deletion behaves like WT.
Figure 4
Figure 4
Transcriptional regulation within the glucose regulatory system. Transcript changes (horizontal) of all essential pathway members, those that upon deletion still behave like WT (“like WT”), as well as transcripts of pathway members categorised into the “high glucose” and “low glucose” group are depicted in the different mutants (vertical). Grey boxes indicate pathway members involved in the metabolic pathways. Colour scale and order of mutants (vertical) as in Figure 2. Transcripts (horizontal) of essential pathway members and members corresponding to mutants that behave like WT are ordered as derived from the hierarchical clustering. The transcript ordering of pathway members included in the “high glucose” and “low glucose group” is the same as for the mutants. The diagonal depicts the deleted genes.
Figure 5
Figure 5
Hierarchical network reconstruction. Tps2 is the most downstream transcriptional component. (A) Possible data observations. A blue edge from x to y indicates decreased transcription of y in the deletion of x, a yellow edge indicates increased transcription. Edges of the same colour going from x and y to downstream target genes denote correlation between the gene expression profiles of and , anti-correlation otherwise. (B) Different types of data observations, as presented in (A), are exemplified. Dashed grey lines indicate 1.5 FC. Solid grey lines indicate the linear regression line fitted through the data points. Deletions of x and y are represented on the x- and y-axis respectively. The transcriptional change of y is highlighted by a red dot. (C) Data interpretations. The two leftmost types of data observations are interpreted as sequential relationships, in which transcriptional changes of downstream target genes observed in the deletion of x are indirect through the transcriptional regulation of y. The two rightmost types of data observations are interpreted as non-sequential relationships such as feedback from y to x itself or downstream target genes of x. (D) Unique edges (green and purple, solid and dashed) are used to denote the different types (L1, L2, F1 and F2, see Methods for details) of data observations in the network. (E) Data observations are summarised and represented as described in (D) for all components of the glucose regulatory system that upon deletion result in significant transcriptional changes compared to WT.
Figure 6
Figure 6
Tps2 is epistatic to both Gpr1 and Ram1. Transcriptional changes upon the single deletion of either TPS2 or GPR1, as well as TPS2 or RAM1 are compared to the effect of their combined deletion. Shown are all transcripts (horizontal) changing significantly (p < 0.01, FC > 1.7) in any of the three deletion mutants (vertical). In both tps2Δgpr1Δ and tps2Δram1Δ double deletions, transcriptional changes of tps2Δ dominate the double mutant gene expression profile. Colour scale as in Figure 2.
Figure 7
Figure 7
A regulatory unit for balancing the storage carbohydrate biosynthesis. The inferred transcription network between Tps2, Tsl1, and Gph1 (purple and green; as in Figure 5E) is integrated into the metabolic pathway (grey) in which they are functioning.

Similar articles

Cited by

References

    1. Santangelo GM. Glucose signaling in saccharomyces cerevisiae. Microbiol Mol Biol Rev. 2006;70:253–282. doi: 10.1128/MMBR.70.1.253-282.2006. - DOI - PMC - PubMed
    1. Smets B, Ghillebert R, Snijder P, Binda M, Swinnen E, Virgilio C, Winderickx J. Life in the midst of scarcity: adaptations to nutrient availability in Saccharomyces cerevisiae. Curr Genet. 2010;56:1–32. doi: 10.1007/s00294-009-0287-1. - DOI - PubMed
    1. Zaman S, Lippman SI, Schneper L, Slonim N, Broach JR. Glucose regulates transcription in yeast through a network of signaling pathways. Mol Syst Biol. 2009;5:245. - PMC - PubMed
    1. Colombo S, Ronchetti D, Thevelein JM, Winderickx J, Martegani E. Activation state of the ras2 protein and glucose-induced signaling in saccharomyces cerevisiae. J Biol Chem. 2004;279:46715–46722. doi: 10.1074/jbc.M405136200. - DOI - PubMed
    1. Wang Y, Pierce M, Schneper L, Güldal CG, Zhang X, Tavazoie S, Broach JR. Ras and Gpa2 mediate one branch of a redundant glucose signaling pathway in yeast. PLoS Biol. 2004;2:E128. doi: 10.1371/journal.pbio.0020128. - DOI - PMC - PubMed

Publication types

MeSH terms