. 2012 Jun 14:13:64.
doi: 10.1186/1471-2202-13-64.

Transcriptome analysis of amoeboid and ramified microglia isolated from the corpus callosum of rat brain

Affiliations

Transcriptome analysis of amoeboid and ramified microglia isolated from the corpus callosum of rat brain

Rangarajan Parakalan et al. BMC Neurosci. .

Abstract

Background: Microglia, the resident immune cells of the central nervous system (CNS), have two distinct phenotypes in the developing brain: amoeboid form, known to be amoeboid microglial cells (AMC) and ramified form, known to be ramified microglial cells (RMC). The AMC are characterized by being proliferative, phagocytic and migratory whereas the RMC are quiescent and exhibit a slow turnover rate. The AMC transform into RMC with advancing age, and this transformation is indicative of the gradual shift in the microglial functions. Both AMC and RMC respond to CNS inflammation, and they become hypertrophic when activated by trauma, infection or neurodegenerative stimuli. The molecular mechanisms and functional significance of morphological transformation of microglia during normal development and in disease conditions is not clear. It is hypothesized that AMC and RMC are functionally regulated by a specific set of genes encoding various signaling molecules and transcription factors.

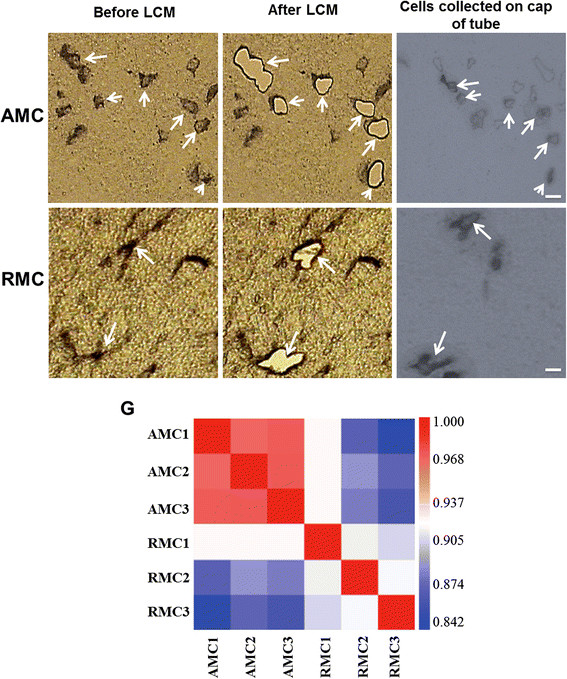
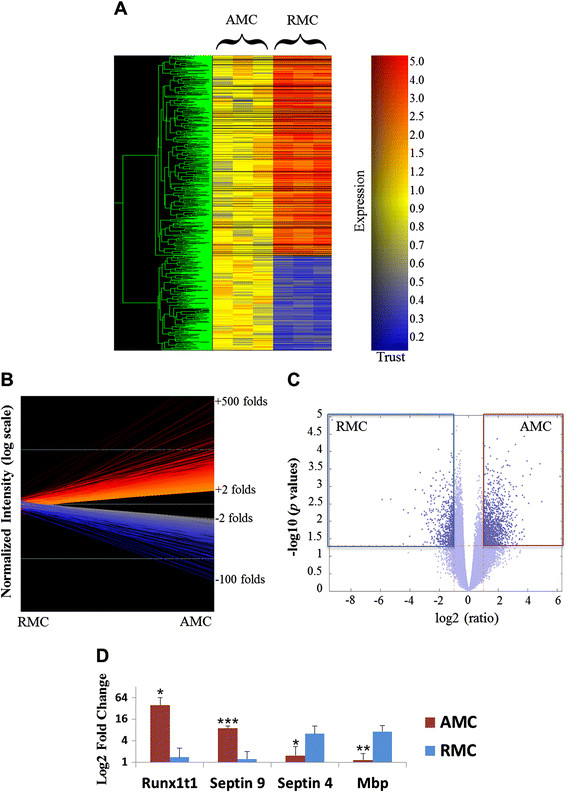
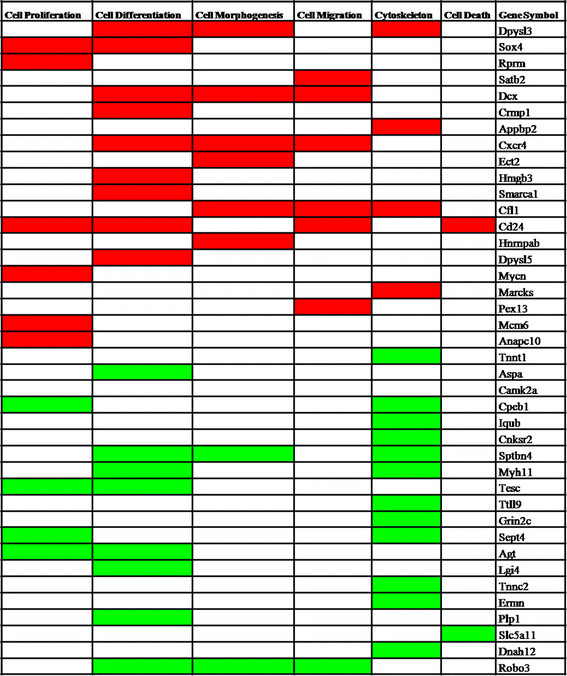
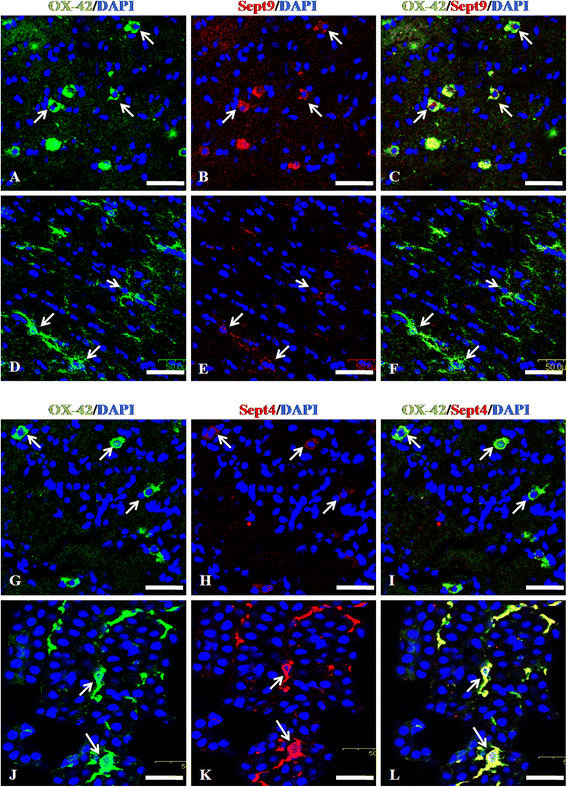
Results: To address this, we carried out cDNA microarray analysis using lectin-labeled AMC and RMC isolated from frozen tissue sections of the corpus callosum of 5-day and 4-week old rat brain respectively, by laser capture microdissection. The global gene expression profiles of both microglial phenotypes were compared and the differentially expressed genes in AMC and RMC were clustered based on their functional annotations. This genome wide comparative analysis identified genes that are specific to AMC and RMC.

Conclusions: The novel and specific molecules identified from the trancriptome explains the quiescent state functioning of microglia in its two distinct morphological states.


Figures

Figure 1
Figure 1
A-F. Identification and isolation of amoeboid microglial cells (AMC) and ramified microglial cells (RMC) from the corpus callosum (CC) of 5-day old and 4-weeks old rat brain respectively. Figure A shows AMC and Figure D shows RMC stained with lectin under laser capture microscopy. These cells are laser-cut along their periphery and isolated. Figure B and E show the region of the stained tissue section wherein the cells have been removed, and figure C and F show the isolated cells collected in the cap of vial. Arrows indicate the same cells in all the three images. Scale bars: A-F 50 μm. G. Correlation plots. Correlation plots were generated in Affymetrix Expression Console 1.1 after RMA normalizing raw CEL files of AMC and RMC expression data. The color scale indicates the degree of correlation between two different samples. A value of close to 1 refers to a high correlation.
Figure 2
Figure 2
A. Cluster Analysis. Cluster analysis shows changes in gene expression profiles of AMC and RMC. Agglomerative average-linkage hierarchical clustering of the six independent samples was obtained for selected groups of genes using GeneSpring 7.3. Each colored box represents the normalized expression level of a given gene in each sample and is colored according to the fold change. B. Line Graph. Represents a two-fold differential gene expression between the AMC and RMC. The lines in red represent gens upregulated and those in blue represent genes downregulated in AMC in comparison to RMC. C. Volcano Plot. Within the lateral quadrants (red and blue box) are the genes with two-fold difference and P Value < 0.05. These genes were chosen for generation of functional group lists. D.Validation of Microarray Profile. Histogram shows the qRTPCR validation of two AMC-specific genes (Runx1t1 and Sept9) and two RMC-specific genes (Sept4 and Mbp).
Figure 3
Figure 3
A-F. Differential immunoexpression of Dcx andRunx1t1 in AMC and RMC. Confocal images showing the immunoexpression of Dcx (B; red) and its co-localization (C) in OX42 (A; green) labeled AMC. Immunoexpression of Runx1t1 (E, H; red) and its co-localization (F, I) in OX42 (D, G; green) labeled AMC and RMC in the CC from 5-day (5D) and 4-week (4 W) old rat brain was also observed. Runx1t1 immunoexpression is undetectable in RMC (I) compared to that in the AMC (F). (DAPI – blue). Scale bars: A-C 50 μm, D-I 10 μm.
Figure 4
Figure 4
Functional clusters to highly-expressed AMC and RMC genes. Heat map shows the top 25 AMC and RMC (arranged according to fold change) and their involvement in major cellular functions. Red shading indicates AMC genes and green shading indicates RMC genes.
Figure 5
Figure 5
A. Functional pathways. Graph shows the number of AMC and RMC genes enriched in different functions. It can be noted that the AMC apart from proliferation and differentiation express a high number of genes involved in cell death whereas the RMC express a high number of cytoskeletal genes. B. Stemness of AMC and RMC. Venn diagrams represent the share of Embryonic (ESC), Neural (NSC) and Hematopoietic (HSC) stem cell genes in AMC and RMC. The AMC express a high number of stem cell genes compared to the RMC. The RMC express more HSC-specific genes than NSC- and ESC- specific genes.
Figure 6
Figure 6
A-I. Differential immunoexpression of Sox4 and Sox11 in AMC and RMC. Confocal images showing a high immunoexpression of Sox4 (B; red) and its co-localization (C) in OX42 (A; green) labeled AMC. Immunoexpression of Sox11 (E, H; red) and its co-localization (F, I) in OX42 (D, G; green) labeled AMC and RMC in the CC from 5-day (5D) and 4-week (4 W) old rat brain was also observed. Sox11immuno expression is undetectable in RMC (I) compared to that in the AMC (F). (DAPI – blue).Scale bars: A-I 10 μm.
Figure 7
Figure 7
A-L. Immunoexpression of Sept9 and Sept4 in RMC. Confocal images showing the immunoexpression of Sept9 and Sept4 (B, E, H, K; red) and their co-localization (C, F, I, L) in OX42 (A, D, G, J; green) labeled AMC and RMC in the CC from 5-day (5D) and 4-week (4 W) old rat brain.Sept9 immunoexpression is undetectable in RMC (F) compared to that in the AMC (C) whereas Sept4 is undetectable in AMC (I) compared to that in the RMC (L). (DAPI – blue).Scale bars: A-L 50 μm.

References

    1. PioDel R-H. THE MICROGLIA. Lancet. 1939;233(6036):1023–1026. doi: 10.1016/S0140-6736(00)60571-8. - DOI
    1. Ling EA, Wong WC. The origin and nature of ramified and amoeboid microglia: a historical review and current concepts. Glia. 1993;7(1):9–18. doi: 10.1002/glia.440070105. - DOI - PubMed
    1. Orłowski D, Sołtys Z, Janeczko K. Morphological development of microglia in the postnatal rat brain: A quantitative study. Int J Dev Neurosci. 2003;21(8):445–450. doi: 10.1016/j.ijdevneu.2003.09.001. - DOI - PubMed
    1. Brockhaus J, Möller T, Kettenmann H. Phagocytozing ameboid microglial cells studied in a mouse corpus callosum slice preparation. Glia. 1996;16(1):81–90. doi: 10.1002/(SICI)1098-1136(199601)16:1<81::AID-GLIA9>3.0.CO;2-E. - DOI - PubMed
    1. Hirasawa T, Kohsaka S. Visualization of microgilia in living tissues using Iba1-EGFP transgenic mice. Brain Nerve. 2007;59(7):763–772. - PubMed

Publication types

MeSH terms

Substances