. 2012 Sep;122(5):976-94.
doi: 10.1111/j.1471-4159.2012.07833.x. Epub 2012 Jul 9.

Harnessing pain heterogeneity and RNA transcriptome to identify blood-based pain biomarkers: a novel correlational study design and bioinformatics approach in a graded chronic constriction injury model

Affiliations

Harnessing pain heterogeneity and RNA transcriptome to identify blood-based pain biomarkers: a novel correlational study design and bioinformatics approach in a graded chronic constriction injury model

Peter M Grace et al. J Neurochem. 2012 Sep.

Abstract

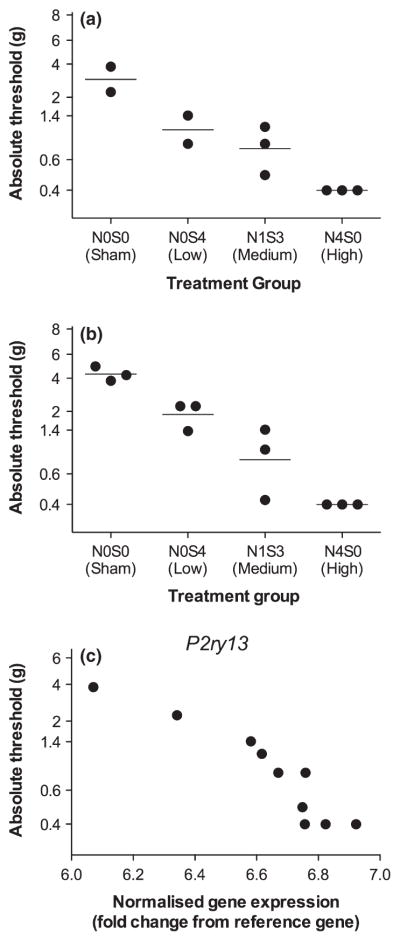
A quantitative, peripherally accessible biomarker for neuropathic pain has great potential to improve clinical outcomes. Based on the premise that peripheral and central immunity contribute to neuropathic pain mechanisms, we hypothesized that biomarkers could be identified from the whole blood of adult male rats, by integrating graded chronic constriction injury (CCI), ipsilateral lumbar dorsal quadrant (iLDQ) and whole blood transcriptomes, and pathway analysis with pain behavior. Correlational bioinformatics identified a range of putative biomarker genes for allodynia intensity, many encoding for proteins with a recognized role in immune/nociceptive mechanisms. A selection of these genes was validated in a separate replication study. Pathway analysis of the iLDQ transcriptome identified Fcγ and Fcε signaling pathways, among others. This study is the first to employ the whole blood transcriptome to identify pain biomarker panels. The novel correlational bioinformatics, developed here, selected such putative biomarkers based on a correlation with pain behavior and formation of signaling pathways with iLDQ genes. Future studies may demonstrate the predictive ability of these biomarker genes across other models and additional variables.


Figures

Fig. 1
Fig. 1
Transcriptome data pipeline developed and employed to identify putative biomarker panels. Red boxes represent putative biomarker panels; blue boxes represent experimental steps and results; green boxes represent bioinformatic steps; white boxes represent supplementary analyses. CCI, chronic constriction injury; iLDQ, ipsilateral lumbar dorsal quadrant; suppl, supplementary. *Genes common to both the iLDQ and whole blood gene lists were retained.
Fig. 2
Fig. 2
Graded chronic constriction injury of the sciatic nerve produces graded allodynia at day 21 post surgery. Graded neuropathy was induced by varying the distribution of four equivalent chromic gut pieces across the nerve (N) or subcutaneous (S) compartments. As such, treatment design was N0S0 (transcriptome study, n = 2 prospective validation study, n = 3), N0S4 (n = 2, 3), N1S3 (n = 3), and N4S0 (n = 3) to generate a single, heterogeneous group with respect to allodynia for correlational analysis in (a) the transcriptome study and; (b) the prospective validation study. (c) As an example, the correlation between ipsilateral lumbar dorsal quadrant P2ry13 gene expression and von Frey threshold is presented. Each point represents an individual rat.
Fig. 3
Fig. 3
‘Adelaide plots’ define the gene list thresholds. Genes from the entire transcriptome were independently ranked according to absolute correlation coefficient (RAACC), for (a) the ipsilateral lumbar dorsal quadrant (iLDQ) transcriptome; (b) the whole blood transcriptome; (c) the combined iLDQ and whole blood transcriptomes. Beginning at the top of the RAACC Gene lists, bins were defined across the RAACC gene lists by selecting 1000 genes and then progressively frame-shifting by 100 genes (such that bin 1 contained genes 1–1000, bin 2 contained genes 101–1100 and so forth), so that each subsequent bin progressively excluded the prior 100 top ranked genes, and each bin analyzed in DAVID 6.7. The number of pathways classified from each bin was quantified and are displayed here as ‘Adelaide plots’, identifying the degree of organization into signaling pathways among the most highly correlated genes. As each bin was progressively analyzed in DAVID 6.7, the RAACC genes being major contributors to signaling pathways related to allodynia were identified as (a) the top 300 iLDQ genes, (b) the top 500 whole blood genes, (c) the top 700 combined iLDQ- and whole blood-RAACC Gene lists. These thresholds were inferred, as exclusion of these genes in Pathway Analyses (i.e. analyses beyond bins 4, 6, and 8, respectively) resulted in the pathway number per bin falling below that expected by chance (≤ 1.8, dotted line defined by random re-sampling of 1000 genes). Thus, Adelaide plots make it possible to identify the division between genes that contribute to signaling pathways and those that do not.
Fig. 4
Fig. 4
Signaling pathways derived from (a) the ipsilateral lumbar dorsal quadrant (iLDQ), and (b) the combined whole blood and iLDQ gene lists. (a) The iLDQ-Adelaide gene list (300 genes; Figure 1) was classified into signaling pathways using DAVID 6.7. (b) The combined iLDQ and whole blood gene lists B (800 genes; Figure 1) were classified into signaling pathways using DAVID 6.7. Bars represent the −log(p value) for that pathway within the gene list (two-tailed Fisher’s exact test; threshold of 1.3 (p = 0.05) used).
Fig. 5
Fig. 5
Relationship between blood ligand and ipsilateral lumbar dorsal quadrant (iLDQ) receptor gene expression in the graded chronic constriction injury model. Of the potential ligand/receptor pairing between the 29 whole blood genes contributing to iLDQ signaling pathways biomarker panel (Table 3) and the iLDQ-Pathway derived Gene list (Fig. 1), the only pairs to form with their cognate receptors in the iLDQ were Csf3 and Cx3cl1. A correlation between the ligands and their cognate receptors found (a) an insignificant inverse relationship between Csf3 and Csf3r; but (b) a significant relationship between Cx3cl1 and Cx3cr1.
Fig. 6
Fig. 6
Prospective validation of select putative biomarker genes. To validate the putative biomarkers identified via our novel data pipeline, a prospective validation study was performed using real-time PCR. A Pearson correlation was performed between gene expression (relative to housekeeping gene) and von Frey threshold. (a–d) The top 4 genes, from the 29 candidate biomarkers panel (Table 3) (Tnfrsf11b; Thra; Avpr1a; Csf3). (e, f) The top 2 genes, ranked by correlation coefficient, from the whole blood RAACC-Gene list were significantly correlated with von Frey threshold (Xylb; Olr952). (g) Of the top 2 genes from the 7 gene candidate biomarkers panel, only Trim30 was significantly correlated with von Frey threshold. (h) Cx3cl1 was also significantly correlated with von Frey threshold. The replication study regression line (black) and statistics, and the transcriptome study regression line (gray) are indicated for reference.
Fig. 7
Fig. 7
Distribution and concordance of published spinal cord and dorsal root ganglia ‘pain genes’ within the ipsilateral lumbar dorsal quadrant (iLDQ) transcriptome dataset. Genes that were identified as having ‘strong correlational’ or ‘causational’ evidential links with rodent neuropathic pain models in the recent meta-analysis by Lacroix-Fralish et al. (2011) were identified within the iLDQ transcriptome dataset (RAACC-Gene list; Figure 1). The ‘pain genes’ dataset was then split according to the concordance or discordance between the direction of correlation between gene expression and von Frey threshold, and the published direction of gene regulation (Lacroix-Fralish et al. 2011). (a) The data was binned in correlation coefficient tertiles and the distribution frequency plotted. (b) Individual points are plotted for concordant genes and overlaid with the correlation coefficient frequency of the entire iLDQ transcriptome. (c) Individual points are plotted for discordant genes and overlaid with the correlation coefficient frequency of the entire iLDQ transcriptome. Dashed lines indicate correlation coefficient tertiles; dotted lines indicate correlation coefficient thresholds defined here using Adelaide plots.

References

    1. Abo-Salem OM, Hayallah AM, Bilkei-Gorzo A, Filipek B, Zimmer A, Muller CE. Antinociceptive effects of novel A2B adenosine receptor antagonists. J Pharmacol Exp Ther. 2004;308:358–366. - PubMed
    1. Alier KA, Chen Y, Sollenberg UE, Langel U, Smith PA. Selective stimulation of GalR1 and GalR2 in rat substantia gelatinosa reveals a cellular basis for the anti- and pro-nociceptive actions of galanin. Pain. 2008;137:138–146. - PubMed
    1. Andoh T, Kuraishi Y. Direct action of immunoglobulin G on primary sensory neurons through Fc gamma receptor I. FASEB J. 2004a;18:182–184. - PubMed
    1. Andoh T, Kuraishi Y. Expression of Fc epsilon receptor I on primary sensory neurons in mice. Neuro Report. 2004b;15:2029–2031. - PubMed
    1. Austin PJ, Moalem-Taylor G. The neuro-immune balance in neuropathic pain: involvement of inflammatory immune cells, immune-like glial cells and cytokines. J Neuroimmunol. 2010;229:26–50. - PubMed

Publication types

MeSH terms