. 2012 Jul 23;52(7):1886-97.
doi: 10.1021/ci300121p. Epub 2012 Jun 25.

Development of a comprehensive, validated pharmacophore hypothesis for anthrax toxin lethal factor (LF) inhibitors using genetic algorithms, Pareto scoring, and structural biology

Affiliations

Development of a comprehensive, validated pharmacophore hypothesis for anthrax toxin lethal factor (LF) inhibitors using genetic algorithms, Pareto scoring, and structural biology

Ting-Lan Chiu et al. J Chem Inf Model. .

Abstract

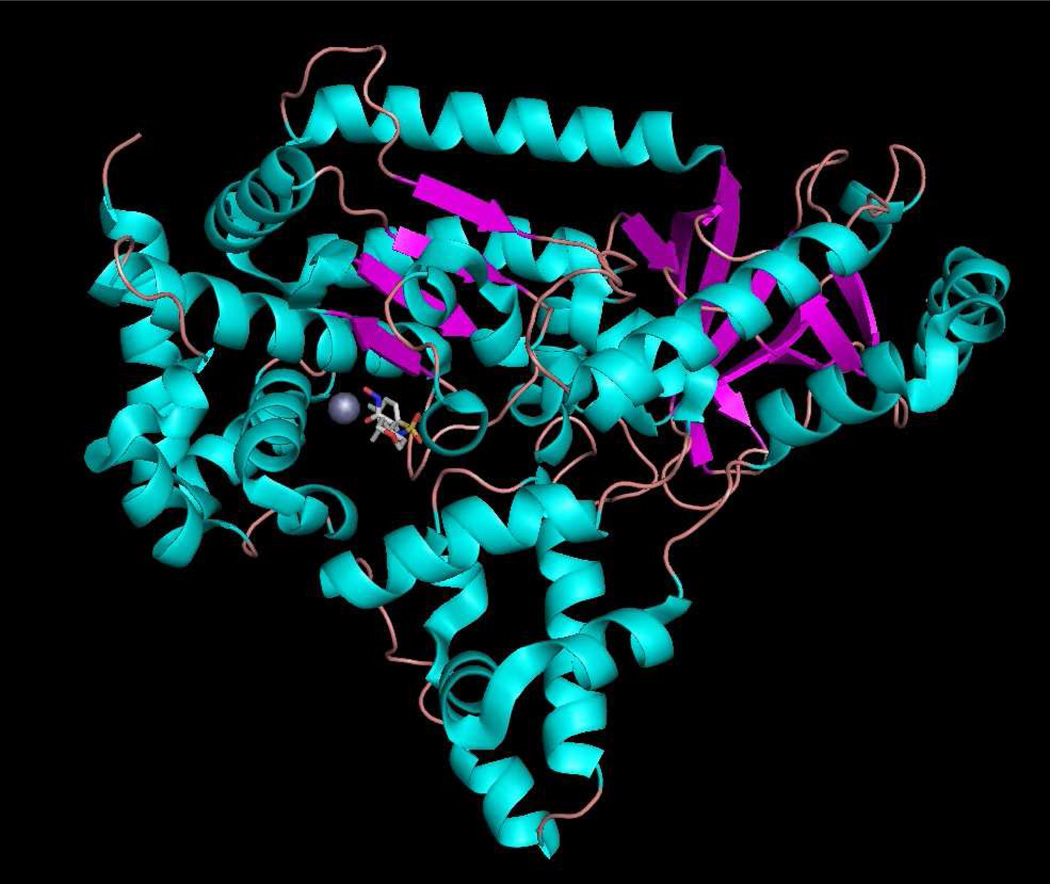
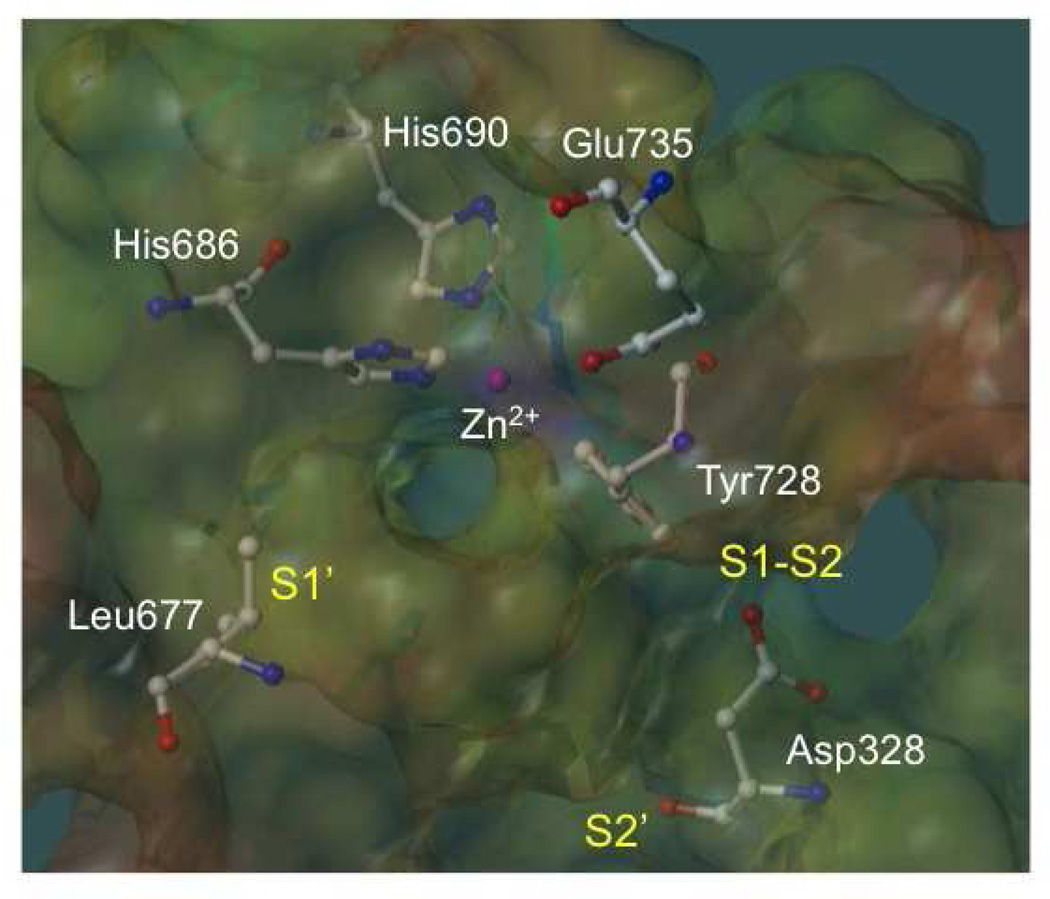
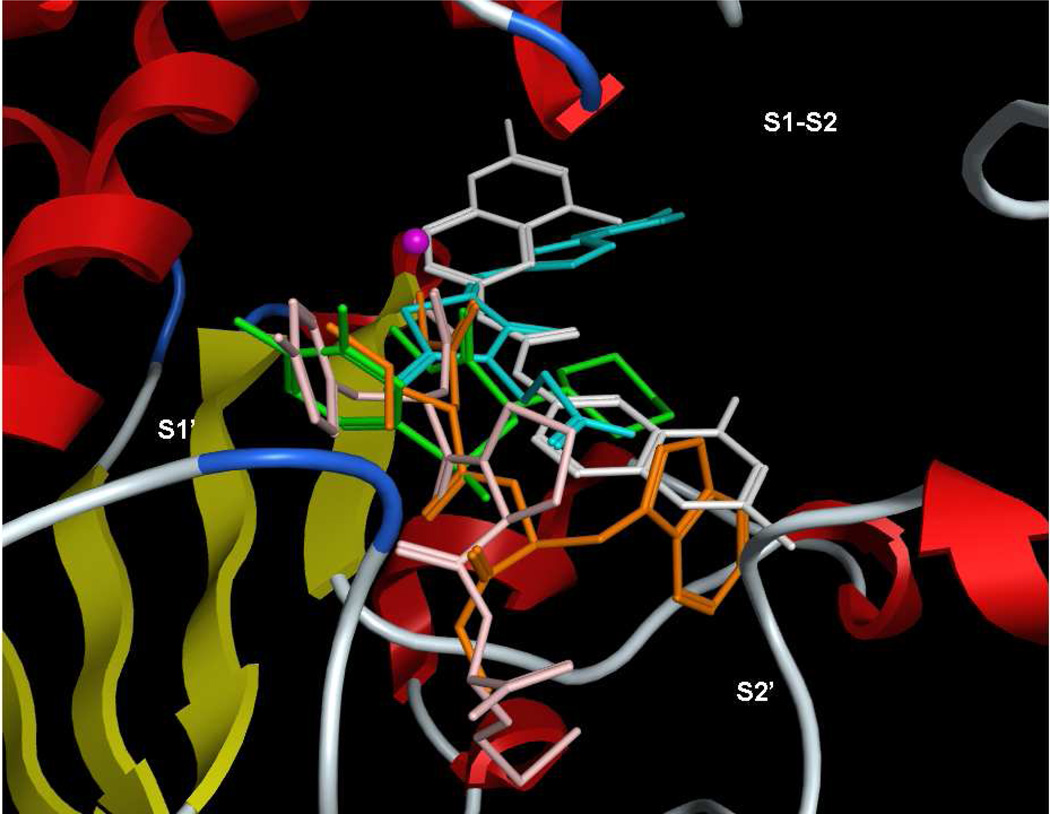
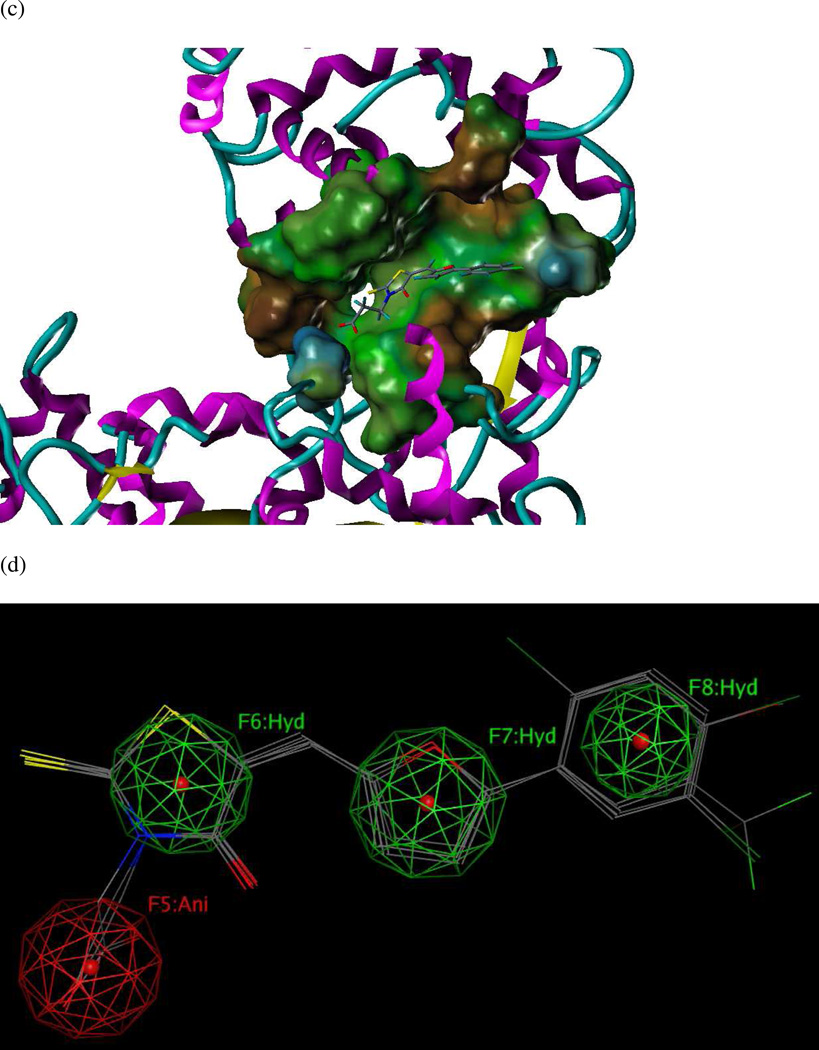
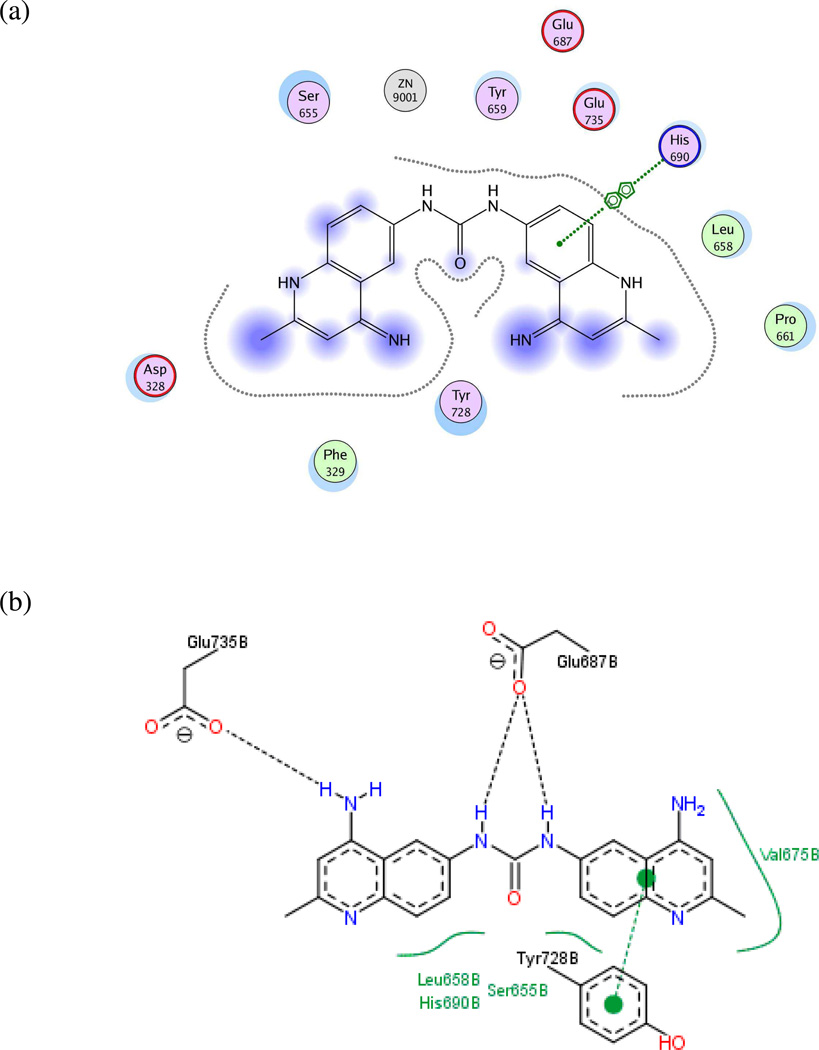
Anthrax is an acute infectious disease caused by the spore-forming bacterium Bacillus anthracis. The anthrax toxin lethal factor (LF), an 89-kDa zinc hydrolase secreted by the bacilli, is the toxin component chiefly responsible for pathogenesis and has been a popular target for rational and structure-based drug design. Although hundreds of small-molecule compounds have been designed to target the LF active site, relatively few reported inhibitors have exhibited activity in cell-based assays, and no LF inhibitor is currently available to treat or prevent anthrax. This study presents a new pharmacophore map assembly, validated by experiment, designed to rapidly identify and prioritize promising LF inhibitor scaffolds from virtual compound libraries. The new hypothesis incorporates structural information from all five available LF enzyme-inhibitor complexes deposited in the Protein Data Bank (PDB) and is the first LF pharmacophore map reported to date that includes features representing interactions involving all three key subsites of the LF catalytic binding region. In a wide-ranging validation study on all 546 compounds for which published LF biological activity data exist, this model displayed strong selectivity toward nanomolar-level LF inhibitors, successfully identifying 72.1% of existing nanomolar-level compounds in an unbiased test set, while rejecting 100% of weakly active (>100 μM) compounds. In addition to its capabilities as a database searching tool, this comprehensive model points to a number of key design principles and previously unidentified ligand-receptor interactions that are likely to influence compound potency.


Figures

Figure 1
Figure 1
Anthrax toxin lethal factor domains II-IV (residues 297–809) (1YQY.pdb), colored by secondary structure, with catalytic Zn2+ (gray sphere) and cocrystallized hydroxamate inhibitor MK-702/LF-1B (visualized in MacPyMOL 1.5.0.1, Schrödinger, LLC).
Figure 2
Figure 2
Active site of the anthrax toxin lethal factor (1YQY.pdb), with MOLCAD electrostatic potential mapping (red = positive, purple = negative); catalytic Zn2+ (magenta sphere); zinc-binding residues His686, His690, and Glu735; and illustrating three binding subsites: S1’, S1–S2, and S2’, visualized in SYBYL 8.0., Tripos, Inc.
Figure 3
Figure 3
Superposition of bound conformations of five active anthrax toxin LF inhibitors, obtained via protein alignment (MOE 2010.10) illustrating the three binding subsites (visualized in MOE 2011.10). White = NSC 12155; orange = GM6001; green = MK-702/LF-1B; cyan = BI-MFM3; pink = thioacetyl-Tyr-Pro-Met-amide.
Figure 4
Figure 4
(a) Ligand-receptor interaction diagram of sulfonamide hydroxamate MK-702 (LF-1B, 40) cocrystallized with the anthrax toxin lethal factor (1YQY.pdb) (MOE 2010.10, Chemical Computing Group, Inc.). In this and subsequent MOE interaction diagrams, green spheres = “greasy” residues; spheres with red outline = acidic residues; spheres with blue outline = basic residues; spheres with black outline = polar residues; blue background spheres = receptor exposure to solvent; blue spheres on ligand atoms = ligand exposure to solvent; green dotted lines = sidechain donors/acceptors; blue dotted lines = backbone donors/acceptors; purple dotted line = metal contact; grey dotted line = proximity contour. (b) Additional ligand-receptor interaction map of MK-702 (LF-1B, 40) bound to LF (1YQY.pdb) (PoseViewWeb); in this and subsequent PoseView interaction diagrams, dashed lines = directed bonds between protein and ligand; spline sections = hydrophobic contacts between ligand moieties and the indicated receptor residues. (c) Preliminary LF inhibitor pharmacophore model UA1 based on a series of highly active analogs of MK-702; green sphere = hydrophobic features; blue spheres = hydrogen-bond donors; pink sphere = hydrogen-bond acceptor (visualized in MOE 2010.10).
Figure 4
Figure 4
(a) Ligand-receptor interaction diagram of sulfonamide hydroxamate MK-702 (LF-1B, 40) cocrystallized with the anthrax toxin lethal factor (1YQY.pdb) (MOE 2010.10, Chemical Computing Group, Inc.). In this and subsequent MOE interaction diagrams, green spheres = “greasy” residues; spheres with red outline = acidic residues; spheres with blue outline = basic residues; spheres with black outline = polar residues; blue background spheres = receptor exposure to solvent; blue spheres on ligand atoms = ligand exposure to solvent; green dotted lines = sidechain donors/acceptors; blue dotted lines = backbone donors/acceptors; purple dotted line = metal contact; grey dotted line = proximity contour. (b) Additional ligand-receptor interaction map of MK-702 (LF-1B, 40) bound to LF (1YQY.pdb) (PoseViewWeb); in this and subsequent PoseView interaction diagrams, dashed lines = directed bonds between protein and ligand; spline sections = hydrophobic contacts between ligand moieties and the indicated receptor residues. (c) Preliminary LF inhibitor pharmacophore model UA1 based on a series of highly active analogs of MK-702; green sphere = hydrophobic features; blue spheres = hydrogen-bond donors; pink sphere = hydrogen-bond acceptor (visualized in MOE 2010.10).
Figure 5
Figure 5
(a) Ligand-receptor interaction diagram of rhodanine derivative BI-MFM3 cocrystallized with the anthrax toxin lethal factor (1ZXV.pdb) (MOE 2010.10). (b) Additional ligand-receptor interaction map of BI-MFM3 bound to LF (1ZXV.pdb) (PoseViewWeb ). (c) MOLCAD Fast Connolly electron density surface of the LF active site (1ZXV.pdb) with lipophilic potential mapping, shown with BI-MFM3; brown = highest lipophilicity; blue = highest hydrophobicity (SYBYL 8.0, Tripos, Inc.). (d) Preliminary LF inhibitor pharmacophore model UA2 derived from three closely related rhodanine analogs; green spheres = hydrophobic features; red sphere = anionic feature (visualized in MOE 2010.10).
Figure 5
Figure 5
(a) Ligand-receptor interaction diagram of rhodanine derivative BI-MFM3 cocrystallized with the anthrax toxin lethal factor (1ZXV.pdb) (MOE 2010.10). (b) Additional ligand-receptor interaction map of BI-MFM3 bound to LF (1ZXV.pdb) (PoseViewWeb ). (c) MOLCAD Fast Connolly electron density surface of the LF active site (1ZXV.pdb) with lipophilic potential mapping, shown with BI-MFM3; brown = highest lipophilicity; blue = highest hydrophobicity (SYBYL 8.0, Tripos, Inc.). (d) Preliminary LF inhibitor pharmacophore model UA2 derived from three closely related rhodanine analogs; green spheres = hydrophobic features; red sphere = anionic feature (visualized in MOE 2010.10).
Figure 6
Figure 6
(a) Ligand-receptor interaction diagram of methylquinoline urea compound NSC 12155 cocrystallized with the anthrax toxin lethal factor (1PWP.pdb) (MOE 2010.10). (b) Additional ligand-receptor interaction map of NSC 12155 bound to LF (1PWP.pdb) (PoseViewWeb). (c) Preliminary LF inhibitor pharmacophore model UA3 derived from the published hypothesis of Panchal et al. and modified based on enzyme-inhibitor interactions observed in the 1PWP.pdb X-ray structure; yellow spheres = aromatic centers (visualized in MOE 2010.10).
Figure 6
Figure 6
(a) Ligand-receptor interaction diagram of methylquinoline urea compound NSC 12155 cocrystallized with the anthrax toxin lethal factor (1PWP.pdb) (MOE 2010.10). (b) Additional ligand-receptor interaction map of NSC 12155 bound to LF (1PWP.pdb) (PoseViewWeb). (c) Preliminary LF inhibitor pharmacophore model UA3 derived from the published hypothesis of Panchal et al. and modified based on enzyme-inhibitor interactions observed in the 1PWP.pdb X-ray structure; yellow spheres = aromatic centers (visualized in MOE 2010.10).
Figure 7
Figure 7
(a) Ligand-receptor interaction diagram of thioacetyl-Tyr-Pro-Met amide cocrystallized with the anthrax toxin lethal factor (1PWQ.pdb) (MOE 2010.10). (b) Additional ligand-receptor interaction map of thioacetyl-Tyr-Pro-Met amide bound to LF (1PWQ.pdb) (PoseViewWeb). (c) Preliminary LF inhibitor pharmacophore model UA4 developed from the 2D enzyme-inhibitor interaction diagrams; green sphere = hydrophobic center; pink spheres = hydrogen-bond acceptors; blue spheres = hydrogen-bond donors (visualized in MOE 2010.10).
Figure 7
Figure 7
(a) Ligand-receptor interaction diagram of thioacetyl-Tyr-Pro-Met amide cocrystallized with the anthrax toxin lethal factor (1PWQ.pdb) (MOE 2010.10). (b) Additional ligand-receptor interaction map of thioacetyl-Tyr-Pro-Met amide bound to LF (1PWQ.pdb) (PoseViewWeb). (c) Preliminary LF inhibitor pharmacophore model UA4 developed from the 2D enzyme-inhibitor interaction diagrams; green sphere = hydrophobic center; pink spheres = hydrogen-bond acceptors; blue spheres = hydrogen-bond donors (visualized in MOE 2010.10).
Figure 8
Figure 8
(a) Ligand-receptor interaction diagram of peptidic matrix metalloproteinase inhibitor GM6001 cocrystallized with the anthrax toxin lethal factor (1PWU.pdb) (MOE 2010.10). (b) Additional ligand-receptor interaction map of GM6001 complexed with LF (1PWU.pdb) (PoseViewWeb). (c) Preliminary LF inhibitor pharmacophore model UA5 developed from the 2D enzyme-inhibitor interaction diagrams; green sphere = hydrophobic center; pink spheres = hydrogen-bond acceptors; blue sphere = hydrogenbond donor (visualized in MOE 2010.10).
Figure 8
Figure 8
(a) Ligand-receptor interaction diagram of peptidic matrix metalloproteinase inhibitor GM6001 cocrystallized with the anthrax toxin lethal factor (1PWU.pdb) (MOE 2010.10). (b) Additional ligand-receptor interaction map of GM6001 complexed with LF (1PWU.pdb) (PoseViewWeb). (c) Preliminary LF inhibitor pharmacophore model UA5 developed from the 2D enzyme-inhibitor interaction diagrams; green sphere = hydrophobic center; pink spheres = hydrogen-bond acceptors; blue sphere = hydrogenbond donor (visualized in MOE 2010.10).
Figure 9
Figure 9
(a) Intermediate comprehensive LF pharmacophore hypothesis UM1A, superimposed on the LF active site (1YQY.pdb), with key receptor residues, catalytic Zn2+ (magenta sphere), and three binding subsites displayed (MOE 2010.10). (b) List of features and their radii in UM1A: Don = hydrogen-bond donor; Ani = anion; Hyd = hydrophobic; Aro = aromatic; Acc = hydrogen-bond acceptor
Figure 9
Figure 9
(a) Intermediate comprehensive LF pharmacophore hypothesis UM1A, superimposed on the LF active site (1YQY.pdb), with key receptor residues, catalytic Zn2+ (magenta sphere), and three binding subsites displayed (MOE 2010.10). (b) List of features and their radii in UM1A: Don = hydrogen-bond donor; Ani = anion; Hyd = hydrophobic; Aro = aromatic; Acc = hydrogen-bond acceptor
Figure 10
Figure 10
(a) Final comprehensive LF pharmacophore hypothesis UM1, superimposed on the LF active site (1YQY.pdb), with key receptor residues, catalytic Zn2+ (magenta sphere), and three binding subsites displayed (MOE 2010.10). (b) List of features and their radii in UM1: Hyd = hydrophobic; Acc = hydrogen-bond acceptor; Don = hydrogen-bond donor
Figure 10
Figure 10
(a) Final comprehensive LF pharmacophore hypothesis UM1, superimposed on the LF active site (1YQY.pdb), with key receptor residues, catalytic Zn2+ (magenta sphere), and three binding subsites displayed (MOE 2010.10). (b) List of features and their radii in UM1: Hyd = hydrophobic; Acc = hydrogen-bond acceptor; Don = hydrogen-bond donor

Similar articles

Cited by

References

    1. Pezard C, Berche P, Mock M. Contribution of individual toxin components to virulence of Bacillus anthracis. Infect. Immun. 1991;59:3472–3477. - PMC - PubMed
    1. Chopra AP, Boone SA, Liang X, Duesbery NS. Anthrax lethal factor proteolysis and inactivation of MAPK kinase. J. Biol. Chem. 2003;278:9402–9406. - PubMed
    1. Bardwell AJ, Abdollahi M, Bardwell L. Anthrax lethal factor-cleavage products of MAPK (mitogen-activated protein kinase) kinases exhibit reduced binding to their cognate MAPKs. Biochem. J. 2004;378:569–577. - PMC - PubMed
    1. Tanoue T, Nishida E. Molecular recognitions in the MAP kinase cascades. Cell. Signal. 2003;15:455–462. - PubMed
    1. Biondi RM, Nebreda AR. Signalling specificity of Ser/Thr protein kinases through docking-site-mediated interactions. Biochem. J. 2003;372:1–13. - PMC - PubMed

Publication types