

Simulating gene-gene and gene-environment interactions in complex diseases: Gene-Environment iNteraction Simulator 2
- PMID: 22698142
- PMCID: PMC3538511
- DOI: 10.1186/1471-2105-13-132
Simulating gene-gene and gene-environment interactions in complex diseases: Gene-Environment iNteraction Simulator 2
Abstract
Background: The analysis of complex diseases is an important problem in human genetics. Because multifactoriality is expected to play a pivotal role, many studies are currently focused on collecting information on the genetic and environmental factors that potentially influence these diseases. However, there is still a lack of efficient and thoroughly tested statistical models that can be used to identify implicated features and their interactions. Simulations using large biologically realistic data sets with known gene-gene and gene-environment interactions that influence the risk of a complex disease are a convenient and useful way to assess the performance of statistical methods.
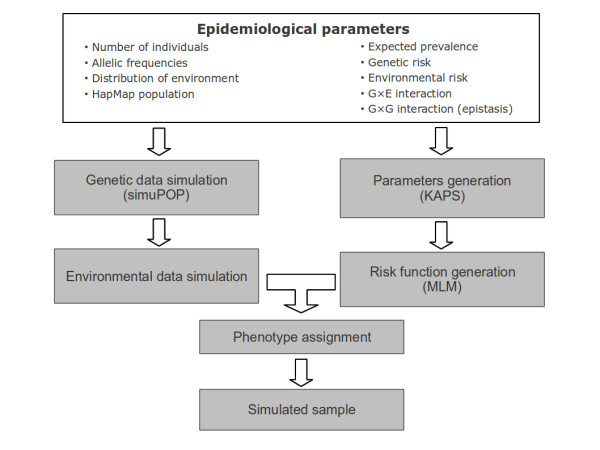
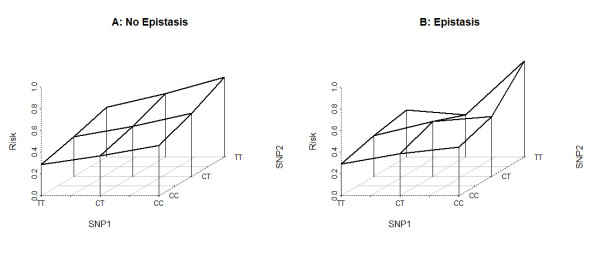
Results: The Gene-Environment iNteraction Simulator 2 (GENS2) simulates interactions among two genetic and one environmental factor and also allows for epistatic interactions. GENS2 is based on data with realistic patterns of linkage disequilibrium, and imposes no limitations either on the number of individuals to be simulated or on number of non-predisposing genetic/environmental factors to be considered. The GENS2 tool is able to simulate gene-environment and gene-gene interactions. To make the Simulator more intuitive, the input parameters are expressed as standard epidemiological quantities. GENS2 is written in Python language and takes advantage of operators and modules provided by the simuPOP simulation environment. It can be used through a graphical or a command-line interface and is freely available from http://sourceforge.net/projects/gensim. The software is released under the GNU General Public License version 3.0.
Conclusions: Data produced by GENS2 can be used as a benchmark for evaluating statistical tools designed for the identification of gene-gene and gene-environment interactions.
Figures
References
-
- Group TGCR. New models of collaboration in genome-wide association studies: the Genetic Association Information Network. Nat Genet. 2007;39(9):1045–51. doi: 10.1038/ng2127. [ http://view.ncbi.nlm.nih.gov/pubmed/17728769] - DOI - PubMed
-
- Weeks DE, Lathrop GM. Polygenic disease: methods for mapping complex disease traits. Trends Genet. 1995;11(12):513–9. doi: 10.1016/S0168-9525(00)89163-5. [ http://view.ncbi.nlm.nih.gov/pubmed/8533170] - DOI - PubMed
-
- Manolio TA, Collins FS, Cox NJ, Goldstein DB, Hindorff LA, Hunter DJ, McCarthy MI, Ramos EM, Cardon LR, Chakravarti A, Cho JH, Guttmacher AE, Kong A, Kruglyak L, Mardis E, Rotimi CN, Slatkin M, Valle D, Whittemore AS, Boehnke M, Clark AG, Eichler EE, Gibson G, Haines JL, Mackay TF, McCarroll SA, Visscher PM. Finding the missing heritability of complex diseases. Nature. 2009;461:747–753. doi: 10.1038/nature08494. - DOI - PMC - PubMed
Publication types
MeSH terms
LinkOut - more resources
Full Text Sources
