. 2012 Sep;237(1):78-89.
doi: 10.1016/j.expneurol.2012.05.015. Epub 2012 Jun 12.

Tissue transglutaminase overexpression does not modify the disease phenotype of the R6/2 mouse model of Huntington's disease

Affiliations

Tissue transglutaminase overexpression does not modify the disease phenotype of the R6/2 mouse model of Huntington's disease

Ashish Kumar et al. Exp Neurol. 2012 Sep.

Abstract

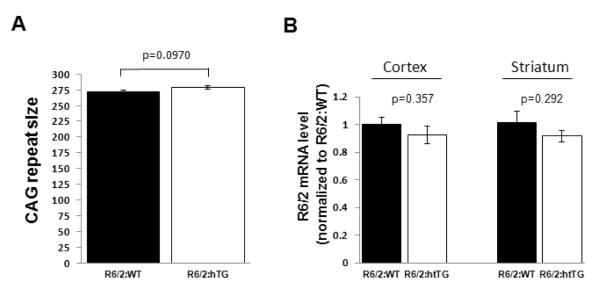
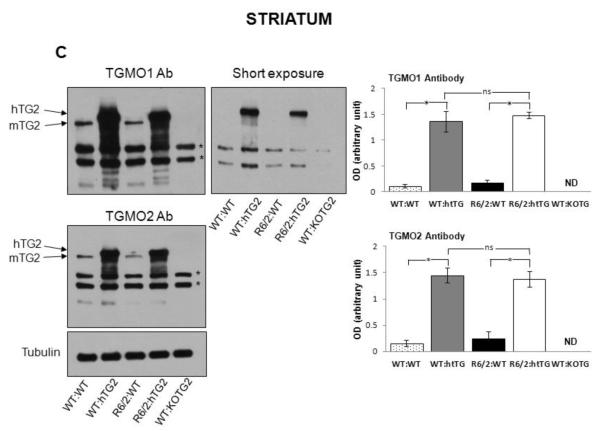
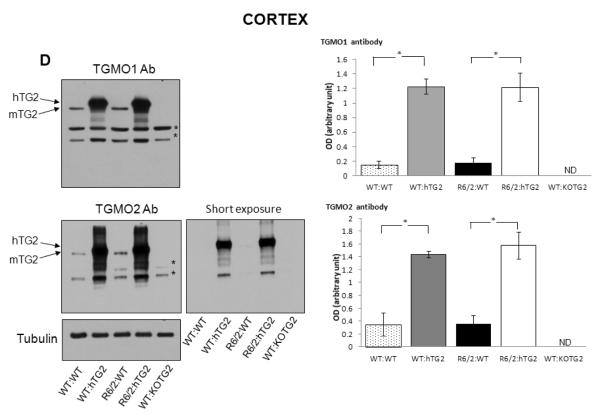
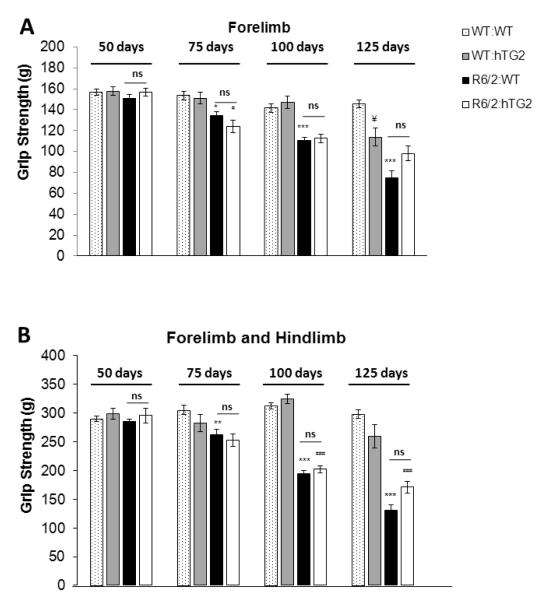
Huntington's disease (HD) is a devastating autosomal-dominant neurodegenerative disorder initiated by an abnormally expanded polyglutamine in the huntingtin protein. Determining the contribution of specific factors to the pathogenesis of HD should provide rational targets for therapeutic intervention. One suggested contributor is the type 2 transglutaminase (TG2), a multifunctional calcium dependent enzyme. A role for TG2 in HD has been suggested because a polypeptide-bound glutamine is a rate-limiting factor for a TG2-catalyzed reaction, and TG2 can cross-link mutant huntingtin in vitro. Further, TG2 is up regulated in brain areas affected in HD. The objective of this study was to further examine the contribution of TG2 as a potential modifier of HD pathogenesis and its validity as a therapeutic target in HD. In particular our goal was to determine whether an increase in TG2 level, as documented in human HD brains, modulates the well-characterized phenotype of the R6/2 HD mouse model. To accomplish this objective a genetic cross was performed between R6/2 mice and an established transgenic mouse line that constitutively expresses human TG2 (hTG2) under control of the prion promoter. Constitutive expression of hTG2 did not affect the onset and progression of the behavioral and neuropathological HD phenotype of R6/2 mice. We found no alterations in body weight changes, rotarod performances, grip strength, overall activity, and no significant effect on the neuropathological features of R6/2 mice. Overall the results of this study suggest that an increase in hTG2 expression does not significantly modify the pathology of HD.


Figures

Figure 1
Figure 1. CAG repeat size, transgene levels and TG2 expression
(A) CAG repeat sizes in the R6/2 transgene were not significantly different (P=0.097) between R6/2 mice that do not express hTG2 (R6/2:WT; n=16) or express the hTG2 transgene (R6/2:hTG2; n=15). Data are presented as mean ± SEM. (B) Expression levels of the R6/2 mRNA in the cortex and striatum of R6/2:WT (n=5) and R6/2:hTG2 (n=6) mice was determined using quantitative real time PCR. No significant difference was detected between the different groups, cortex (pairwise comparison, P=0.36) and striatum (pairwise comparison, P=0.29). Data are presented as mean ± SEM. (C-D) Representation immunoblots with the TGMO1 or TGMO2 antibodies from a typical experiment and quantitative analysis demonstrating that there was no significant effect of the R6/2 transgene on the robust expression of the hTG2 transgene in the striatum (C) and in the cortex (D) of R6/2:hTG2 mice when compared to WT:hTG2 mice. There was also no significant effect of the R6/2 transgene on the expression of endogenous mTG2 in the striatum (C) and cortex (D) of R6/2:WT mice when compared to WT:WT mice. Tubulin immunoreactivity demonstrated that similar amount of proteins from the different cell homogenates were loaded into the different lanes of the gels and was used to normalized hTG2 and mTG2 immunoreactivities. Tissues from TG2 knockout mice (WT:KOTG2) were used to demonstrate the specificity of the antibodies against human TG2 (hTG2) and murine TG2 (mTG2). In (C) and (D) * denotes non-specific reactivity of the TGMO1 and TGMO2 antibodies, and 20 μg of total protein from the striatum or the cortex were loaded in each lane. Data are presented as mean ± SEM from 3 independent experiments. ND: not detected. (E) Endogenous mTG2 expression was robust in the liver of mice from the different groups, but as expected not detected in liver from TG2 knockout mice (WT:KOTG2). 10 μg of total liver protein were loaded in each lane. hTG2 was not detected in the liver samples, and hTG2 transgene expression was essentially limited to CNS neurons. Arrow indicates where hTG2 transgene product should be identified.
Figure 2
Figure 2. Constitutive expression of hTG2 does not alter the onset or extent of body weight loss in R6/2 mice
Body weights of male WT:WT; WT:hTG2; R6/2:WT and R6/2:hTG2 mice. Weight loss of R6/2 mice is not altered by the constitutive expression of hTG2. Data are presented as mean ± SEM.
Figure 3
Figure 3. Constitutive expression of hTG2 does not alter the rotarod performance of R6/2 mice
Motor coordination was assessed with an accelerating rotarod (4 to 40 rpm), and rotarod tests were performed in two phases: training and testing. On the first day mice were subjected to three trials (trials 1 to 3) during this training phase mice were allowed to become accustomed to the rod. Subsequently and for the next five days, mice were tested with one trial per day (trials 4 to 8). (A) Times before fall from rotarod at accelerating speeds of WT:WT (n=19 to 22); WT:hTG2 (n=6 to 14); R6/2:WT (n=21 to 32), and R6/2:hTG2 (n=9 to 18) male mice were monitored at 50, 75, 100 and 125 days of age. Data are presented as mean ± SEM, WT:WT versus R6/2:WT, # p<0.05; WT:WT versus WT:hTG2, * p<0.05.
Figure 4
Figure 4. Constitutive expression of hTG2 does not alter the weakening grip strength of R6/2 mice
Forelimb (A) and combined (forelimb + hindlimb) (B) muscular strengths of WT:WT (n=20 to 29), WT:hTG2 (n=7 to 14), R6/2:WT (n=20 to 31), and R6/2:hTG2 (n=7 to 15) mice at 50, 75, 100, and 125 days of age. Data are presented as mean ± SEM. WT:WT versus R6/2:WT, *p<0.05; WT:hTG2 versus R6/2:hTG2, # p<0.05.
Figure 5
Figure 5. Effects of hTG2 expression on spontaneous locomotor activities and activity rhythms of R6/2 mice
Home cages activities of 50, 75, 100, and 125 days old WT:WT (n=17 to 25); WT:hTG2 (n=6 to 9); R6/2:WT (n=6 to 22) and R6/2:hTG2 (n=3 to 7) male mice was monitored over a 24 hours period following a 3 days acclimation period. Results are presented as an average of lower beams broken (horizontal activity; A-C) and upper beams broken (rearing activity; D-F) over a 24 hours light and dark period (A, D); a 12 hours light period (B, E); and a 12 hours dark period (C, F). Over time there was no significant effect of the hTG2 genotype on the progressive decline in horizontal activity and rearing activity of R6/2 mice. All data are presented as mean ± SEM. WT:WT versus R6/2:WT, *p<0.05; WT:hTG2 versus R6/2:hTG2, # p<0.05.
Figure 6
Figure 6. Effects of hTG2 expression on the neuropathological phenotype of R6/2 mice
(A) Representative photomicrographs of NeuN immunostaining within the striatum of WT:WT; WT:hTG2; R6/2:WT and R6/2:hTG2 mice. Scale bar equals 100 μm. Unbiased stereology analysis examining (B) the total number of striatal NeuN positive stained cells and (C) striatal volume of 18 to19 weeks old WT:WT (n=5); WT:hTG2 (n=3); R6/2:WT (n=5) and R6/2:hTG2 (n=5) mice. There was no significant different on the total number of NeuN positive neurons (P=0.17) and the striatal volume (P=0.98) between R6/2:WT and R6/2:hTG2 mice.
Figure 7
Figure 7. Effects of hTG2 expression on huntingtin protein aggregates
(A) Representative photomicrographs of huntingtin protein immunostaining within the striatum of WT:WT, WT:hTG2, R6/2:WT and R6/2:hTG2 mice. Scale bar equals 10 μm. (B) Unbiased stereology analysis examining the number and density of huntingtin aggregates within the striatum of R6/2:WT (n=5) and R6/2:hTG2 (n=5) mice. The hTG2 genotype did not significantly affect the density of htt aggregates in the striatum of R6/2 mice (P=0.59). Data are presented as mean ± SEM.

Similar articles

Cited by

References

    1. Bailey CD, Johnson GV. Tissue transglutaminase contributes to disease progression in the R6/2 Huntington’s disease mouse model via aggregate-independent mechanisms. J Neurochem. 2005;92:83–92. - PubMed
    1. Bailey CD, Johnson GV. The protective effects of cystamine in the R6/2 Huntington’s disease mouse involve mechanisms other than the inhibition of tissue transglutaminase. Neurobiol Aging. 2006;27:871–879. - PubMed
    1. Beal MF. Huntington’s disease, energy, and excitotoxicity. Neurobiol Aging. 1994;15:275–276. - PubMed
    1. Beal MF. Mitochondria, free radicals, and neurodegeneration. Curr Opin Neurobiol. 1996;6:661–666. - PubMed
    1. Bezprozvanny I, Hayden MR. Deranged neuronal calcium signaling and Huntington disease. Biochemical and biophysical research communications. 2004;322:1310–1317. - PubMed

Publication types

MeSH terms

Substances