. 2012 Aug;61(8):2037-44.
doi: 10.2337/db11-1746. Epub 2012 Jun 14.

Autoantigen-specific B-cell depletion overcomes failed immune tolerance in type 1 diabetes

Affiliations

Autoantigen-specific B-cell depletion overcomes failed immune tolerance in type 1 diabetes

Rachel A Henry et al. Diabetes. 2012 Aug.

Abstract

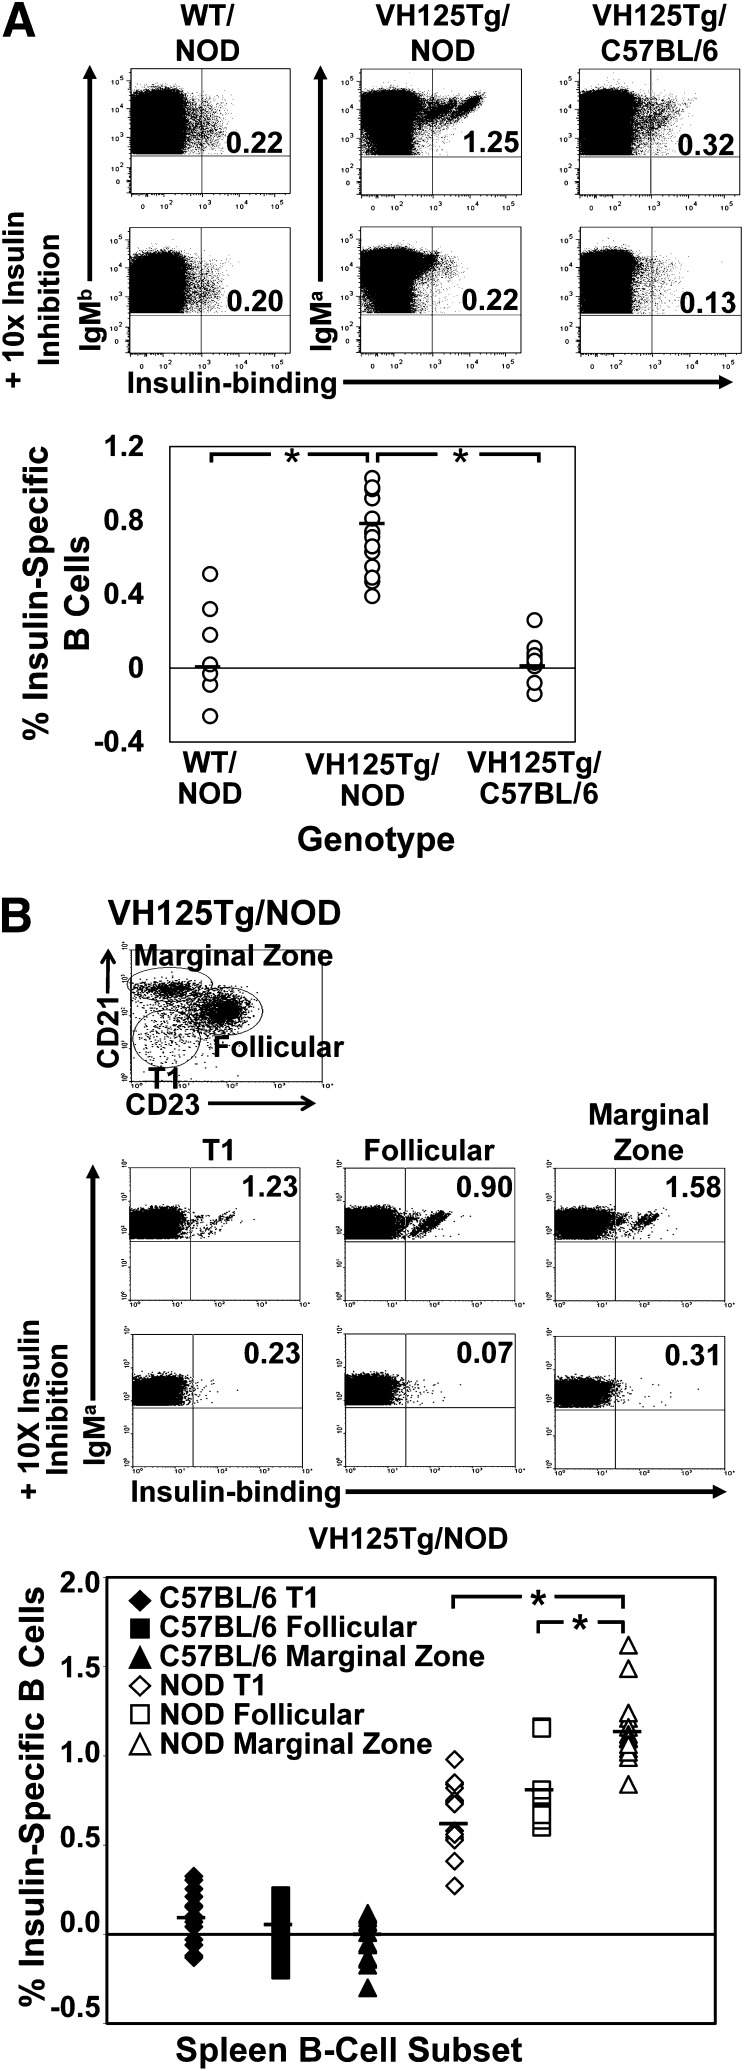
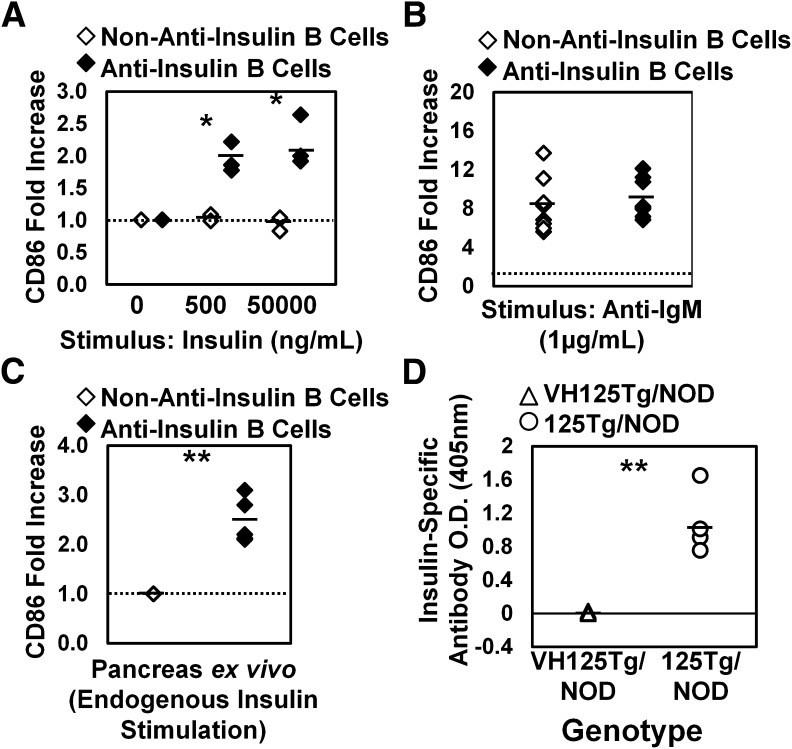
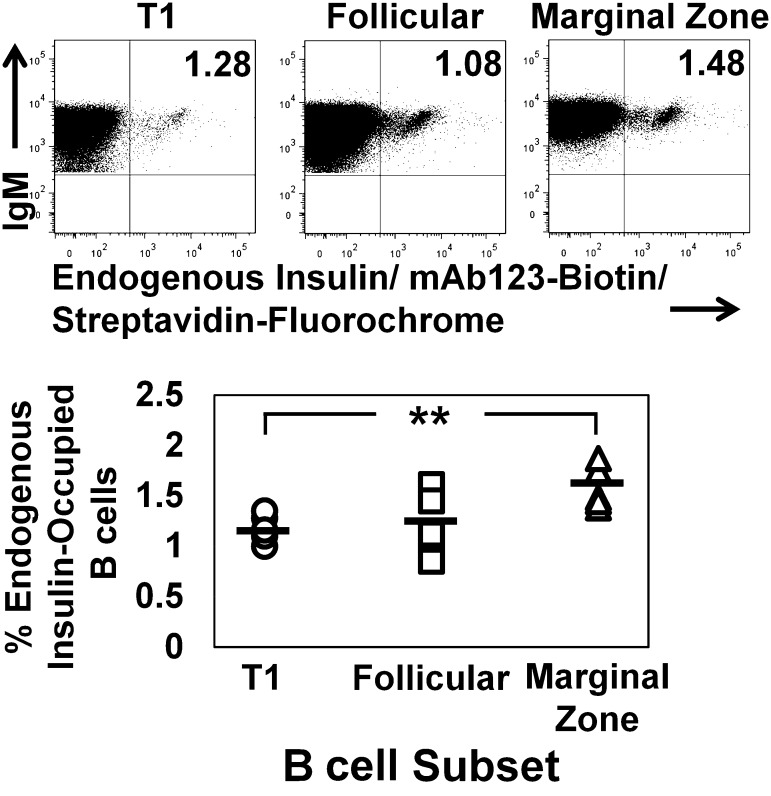
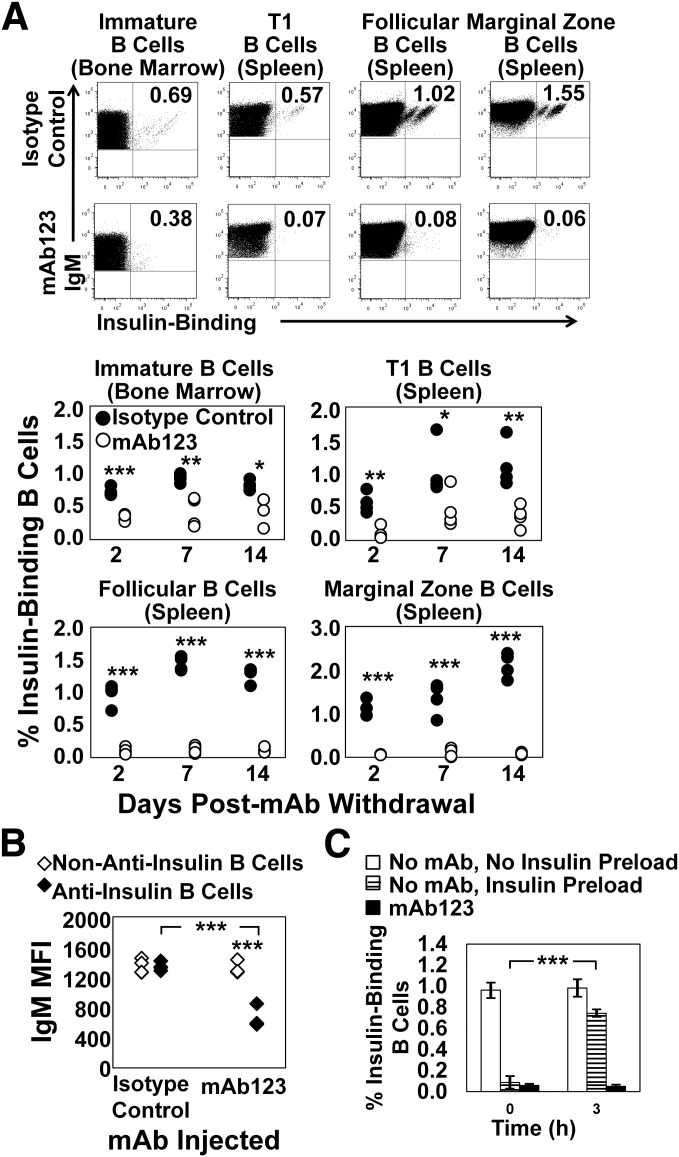
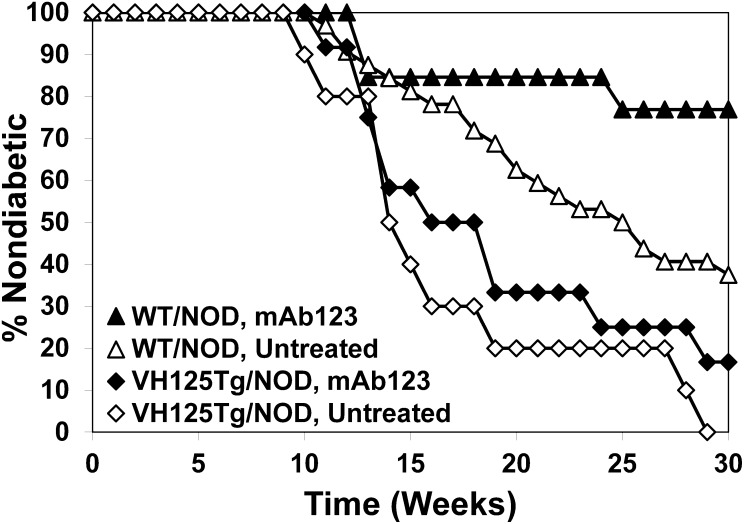
Eliminating autoantigen-specific B cells is an attractive alternative to global B-cell depletion for autoimmune disease treatment. To identify the potential for targeting a key autoimmune B-cell specificity in type 1 diabetes, insulin-binding B cells were tracked within a polyclonal repertoire using heavy chain B-cell receptor (BCR) transgenic (VH125Tg) mice. Insulin-specific B cells are rare in the periphery of nonautoimmune VH125Tg/C57BL/6 mice and WT/NOD autoimmune mice, whereas they clearly populate 1% of mature B-cell subsets in VH125Tg/NOD mice. Autoantigen upregulates CD86 in anti-insulin B cells, suggesting they are competent to interact with T cells. Endogenous insulin occupies anti-insulin BCR beginning with antigen commitment in bone marrow parenchyma, as identified by a second anti-insulin monoclonal antibody. Administration of this monoclonal antibody selectively eliminates insulin-reactive B cells in vivo and prevents disease in WT/NOD mice. Unexpectedly, developing B cells are less amenable to depletion, despite increased BCR sensitivity. These findings exemplify how a critical type 1 diabetes B-cell specificity escapes immune tolerance checkpoints. Disease liability is corrected by eliminating this B-cell specificity, providing proof of concept for a novel therapeutic approach for autoimmune disease.


Figures

FIG. 1.
FIG. 1.
Anti-insulin B cells escape central tolerance to populate transitional, follicular, and marginal zone B-cell subsets in the spleen of VH125Tg/NOD mice. Freshly isolated spleen cells from NOD or C57BL/6 VH125Tg mice were analyzed using flow cytometry to detect insulin-binding B cells. Duplicate samples were incubated with 10-fold excess unlabeled insulin to show binding specificity. The percent age of insulin-specific B cells was calculated as in RESEARCH DESIGN AND METHODS. A: Top: Representative plots, gated on B220+ IgMa+ live lymphocytes. Bottom: Independent WT/NOD, VH125Tg/NOD, or VH125Tg/C57BL/6 mice are plotted; n ≥ 7 mice, n ≥ 4 experiments. B: Top and middle: Representative plots gated on B220+ IgMa+ live lymphocytes and further gated on CD21 and CD23 expression to identify insulin-specific B cells in T1 (CD21lo CD23lo), follicular (CD21lo CD23high), or marginal zone (CD21high CD23lo) B-cell compartments. Bottom: Individual mice are plotted; black symbols are C57BL/6, and white symbols are NOD. B-cell compartments indicated as follows: T1: diamonds (♦, ◇), follicular: squares (■, □), or marginal zone: triangles (▲, △). n ≥ 14 8- to 14-week-old mice; n ≥ 2 experiments. *P < 0.001 as calculated by a two-tailed t test.
FIG. 2.
FIG. 2.
Insulin invokes CD86 upregulation in anti-insulin B cells, preparing them to interact with autoreactive T cells, whereas autoantibody production is silenced. Spleens were harvested from VH125Tg/NOD mice (10–13 weeks old), and cells were cultured for 18 h in complete media plus stimulus indicated. Flow cytometry was used to assess the MFI of CD86 on non–insulin-binding or insulin-binding immature B cells (live B220midIgM+ lymphocytes). AC: Non–insulin-binding (◇) or insulin-binding (♦) B cells are indicated. A: Splenocytes were cultured with 0, 0.5, or 50 µg/mL human insulin, and the CD86 MFI of insulin-stimulated cells was divided by the CD86 MFI of unstimulated cells to calculate CD86 fold upregulation of non–insulin-binding or insulin-binding B cells. n = 3 mice; one experiment. B: VH125Tg/C57BL/6 or VH125Tg/NOD splenocytes were cultured with no stimulus or 1 μg/mL anti-IgM, and CD86 fold upregulation was determined. n = 8 mice; n = 2 experiments. C: Cells were freshly isolated from pancreata and stained on ice with 50 ng/mL human insulin (to ensure BCR occupancy), and insulin-binding B cells were identified using mAb123 staining. CD86 fold upregulation was identified among live B220+ IgMa+ lymphocytes by dividing the CD86 MFI of insulin-binding B cells by the CD86 MFI of non–insulin-binding B cells present in the same organ. n = 5 mice; n = 2 experiments. D: ELISA was used as described in RESEARCH DESIGN AND METHODS to detect anti-insulin IgMa antibodies in sera harvested from unimmunized mice of the indicated genotypes. n = 14 VH125Tg/NOD (△) or n = 4 125Tg/NOD (○) positive control 6- to 14-week-old mice. n = 3 experiments. *P < 0.01; **P < 0.001, as calculated by a two-tailed t test.
FIG. 3.
FIG. 3.
Endogenous insulin autoantigen occupies the BCR of developing and mature insulin-binding B cells in the spleen. Freshly isolated splenocytes were harvested from VH125Tg/NOD mice and stained with mAb123-biotin to recognize BCRs occupied with endogenous rodent insulin. Live B220+ IgM+ lymphocytes were further gated as in Fig. 1 to identify T1 (○), follicular (□), and marginal zone (△) B-cell subsets. Top: Representative plots are shown. Bottom: Summary graphs show n = 5 6- to 12-week-old mice; n = 2 experiments.
FIG. 4.
FIG. 4.
Autoantigen-targeted mAb specifically eliminates insulin-binding B cells while preserving the broad repertoire. A and B: VH125Tg/NOD mice were injected i.p. with 0.1 mg of mAb123 or 0.1 mg of a mouse IgG1 isotype control antibody once weekly for 3 weeks (four 7- to 12-week-old mice per group per time point). After 2, 7, or 14 days, BM and spleens were harvested. A: Insulin-binding B cells were identified in the BM—immature B cells (B220+IgMa+CD23 live lymphocytes)—or the spleen (B220+IgMa+ live lymphocyte gated): T1 B cells (CD21lo CD23lo), follicular B cells (CD21mid CD23hi), or marginal zone B cells (CD21hi CD23mid). Top: Representative plots from 2 days after final mAb injection. Bottom: Individual mice are plotted: isotype control-treated mice (●) and mAb123-treated mice (○). B-cell subset is indicated above chart. n = 4. Similar data were obtained in at least three experiments. B: The IgMa MFI is shown for non–insulin-binding (◇) or insulin-binding (♦) immature B cells from isotype control or mAb123-treated mice from A; organs harvested 2 days after final mAb injection. C: Spleens were harvested from VH125Tg/NOD mice that were untreated (white bars) or injected i.p. weekly for 3 weeks with 0.1 mg mAb123 (black bars). As a positive control, spleens were also harvested from untreated mice, and splenocytes were incubated with 50 µg/mL insulin to competitively inhibit binding by biotinylated insulin (striped bars). Splenocytes were plated in complete media and incubated for 0–3 h at 37°C. Cells were then immediately stained with reagents reactive with B220, IgMa, and 7-aminoactinomycin D, as well as biotinylated insulin. The percentage of live B220+IgMa+ lymphocytes detected by biotinylated insulin is plotted for each condition. n = 3 mice; data are representative of two experiments. *P < 0.05; **P < 0.01; ***P < 0.001 as calculated by a two-tailed t test.
FIG. 5.
FIG. 5.
Selective depletion of anti-insulin B cells by mAb123 protects against disease in WT/NOD mice. WT/NOD or VH125Tg/NOD mice were injected with 0.1 mg of mAb123 once every other week beginning at 3 weeks of age. Diabetes outcome was monitored as in RESEARCH DESIGN AND METHODS. WT/NOD untreated mice (△; n = 32), WT/NOD mAb123-treated mice (▲; n = 13), VH125Tg/NOD untreated mice (◇; n = 10), and VH125TgNOD mAb123-treated mice (♦; n = 12) are shown in a Kaplan-Meier survival plot. WT/NOD mAb123 versus WT/NOD untreated: P < 0.05 as calculated by a log-rank test.

Similar articles

Cited by

References

    1. Pescovitz MD, Greenbaum CJ, Krause-Steinrauf H, et al. Type 1 Diabetes TrialNet Anti-CD20 Study Group . Rituximab, B-lymphocyte depletion, and preservation of beta-cell function. N Engl J Med 2009;361:2143–2152 - PMC - PubMed
    1. Yu L, Herold K, Krause-Steinrauf H, et al. Type 1 Diabetes TrialNet Anti-CD20 Study Group . Rituximab selectively suppresses specific islet antibodies. Diabetes 2011;60:2560–2565 - PMC - PubMed
    1. Steck AK, Johnson K, Barriga KJ, et al. . Age of islet autoantibody appearance and mean levels of insulin, but not GAD or IA-2 autoantibodies, predict age of diagnosis of type 1 diabetes: diabetes autoimmunity study in the young. Diabetes Care 2011;34:1397–1399 - PMC - PubMed
    1. Nakayama M, Abiru N, Moriyama H, et al. . Prime role for an insulin epitope in the development of type 1 diabetes in NOD mice. Nature 2005;435:220–223 - PMC - PubMed
    1. Hulbert C, Riseili B, Rojas M, Thomas JW. B cell specificity contributes to the outcome of diabetes in nonobese diabetic mice. J Immunol 2001;167:5535–5538 - PubMed

Publication types