Comparative Study
. 2012 Nov;22(11):2514-24.
doi: 10.1007/s00330-012-2519-x. Epub 2012 Jun 15.

Characterization of focal liver lesions using quantitative techniques: comparison of apparent diffusion coefficient values and T2 relaxation times

Affiliations
Comparative Study

Characterization of focal liver lesions using quantitative techniques: comparison of apparent diffusion coefficient values and T2 relaxation times

Andrzej Cieszanowski et al. Eur Radiol. 2012 Nov.

Abstract

Objectives: To compare the efficacy of two quantitative methods for discrimination between benign and malignant focal liver lesions (FLLs): apparent diffusion coefficient (ADC) values and T2 relaxation times.

Methods: Seventy-three patients with 215 confirmed FLLs (115 benign, 100 malignant) underwent 1.5-T MRI with respiratory-triggered single-shot SE DWI (b = 50, 400, 800) and dual-echo T2TSE (TR = 3,000 ms; TE1 = 84 ms; TE2 = 228 ms). ADC values and T2 relaxation times of FLLs were calculated. Sensitivity, specificity and accuracy of both techniques in diagnosing malignancy were assessed.

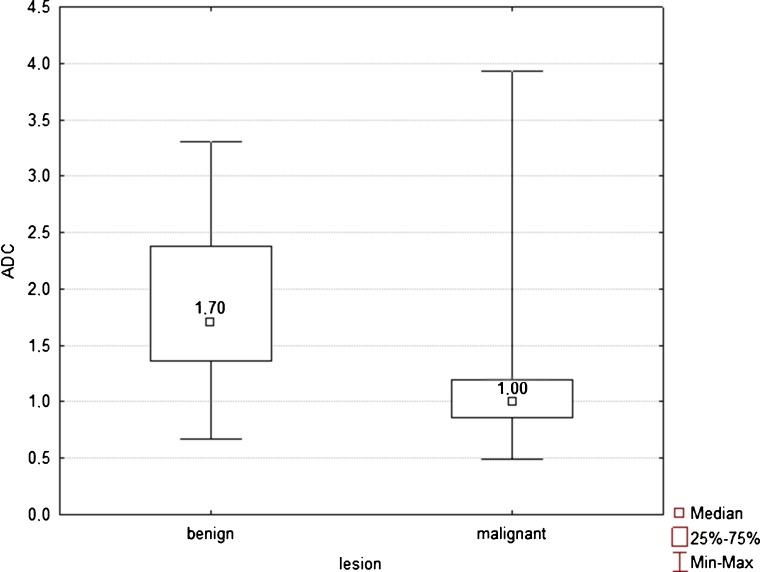
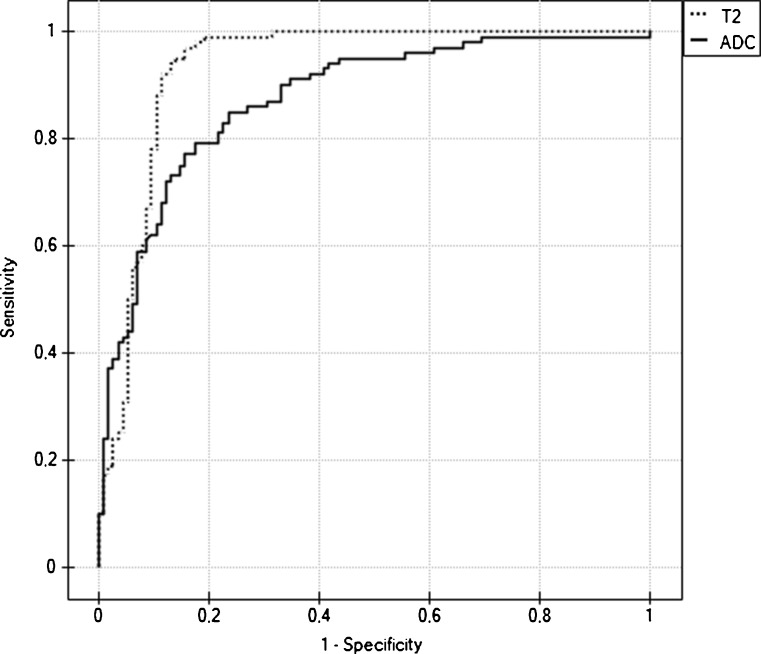
Results: The mean ADC value of malignant tumours (1.07 × 10(-3) mm(2)/s) was significantly lower (P < 0.05) than that of benign lesions (1.86 × 10(-3) mm(2)/s ); however, with the use of the optimal cut-off value of 1.25 × 10(-3) mm(2)/s, 20 false positive (FP) and 20 false negative (FN) diagnoses of malignancy were noted, generating 79 % sensitivity, 82.6 % specificity and 80.9 % accuracy. The mean T2 relaxation time of malignant tumours (64.4 ms) was significantly lower (P < 0.05) than that of benign lesions (476.1 ms). At the threshold of 107 ms 22 FP and 1 FN diagnoses were noted; the sensitivity was 99 %, specificity 80.9 % and accuracy 89.3 %.

Conclusions: Quantitative analysis of T2 relaxation times yielded significantly higher sensitivity and accuracy in diagnosing malignant liver tumour than ADC values.

Key points: • Diffusion-weighted magnetic resonance imaging is increasingly used for liver lesions. • But ADC values demonstrated only moderate accuracy for differentiation of liver lesions. • T2 relaxation times yielded higher accuracy in diagnosing malignant liver tumours. • Both ADC and T2 values overlapped between focal nodular hyperplasia and malignant lesions. • Nevertheless T2 liver mapping could be valuable for evaluating focal liver lesions.


Figures

Fig. 1
Fig. 1
Box plots of ADC values of 115 benign and 100 malignant liver lesions show that despite ADC values of benign lesions being significantly higher than those of malignant tumours (P < 0.001), ADC values of both lesion types considerably overlapped. Median is shown as a small box inside each bar
Fig. 2
Fig. 2
Box plots of T2 relaxation times of 115 benign and 100 malignant liver lesions show that T2 times of benign lesions were significantly higher than those of malignant tumours (p < 0.001), although there is some overlap. Median is shown as a small box inside (benign lesions) or outside (malignant lesions) bars. Nineteen benign lesions (18 cysts and 1 abscess) with T2 relaxation times above 1,000 ms were excluded from the plot for the sake of better visualisation
Fig. 3
Fig. 3
ROC curves for ADC values (line) and T2 relaxation times (dots) show that T2 times were more effective than ADC values in classification of focal liver lesions. The area under the ROC curve for T2 times (0.932; 95 % CI 0.891, 0.962) was significantly larger than the area under the ROC curve for ADC values (0.874; 95 % CI 0.823, 0.962)
Fig. 4
Fig. 4
MR images obtained in a 51-year-old woman with liver metastases from neuroendocrine cancer. a b = 50 s/mm2 DW SS EPI image. b b = 800 s/mm2 DW SS EPI image. c Corresponding ADC map. Double echo TSE images: d TR/TE: 3,000/84 ms, e TR/TE 3,000/228 ms. The first metastatic lesion (arrow) displaying increased signal intensity on b = 50 and b = 800 images and on ADC map had an ADC value of 1.43 × 10−3 mm2/s (false negative diagnosis of malignancy). The second lesion (arrowhead) shows increased signal intensity on b = 50 and b = 800 images and decreased signal on ADC map consistent with restricted diffusion (ADC value = 1.24 × 10−3 mm2/s). Both lesions had T2 relaxation times in the range of those of a malignant lesion (58.9 ms and 98.6 ms)
Fig. 5
Fig. 5
MR images obtained in a 53-year-old woman with hepatic haemangiomas. a b = 50 s/mm2 DW SS EPI image. b b = 800 s/mm2 DW SS EPI image. c Corresponding ADC map. Double echo TSE images: d TR/TE 3,000/84 ms, e TR/TE 3,000/228 ms. Both haemangiomas show increased signal intensity on b = 50 and b = 800 images and on ADC map; however, in the case of the haemangioma located in the left liver lobe (arrow), the decrease in signal intensity on b = 800 image and hyperintensity on ADC map are more pronounced (ADC value = 1.75 × 10−3 mm2/s—true negative case) than in the second haemangioma (arrowhead) located in the right liver lobe (ADC value of 1.23 × 10−3 mm2/s—false positive diagnosis of malignancy). T2 time of the haemangioma in left liver lobe (arrow) is in the range of those of malignancies (80.9 ms), whereas T2 time of second haemangioma (125.5 ms) is in the range of those of benign lesions
Fig. 6
Fig. 6
MR images obtained in an 83-year-old man with hepatic abscesses located in segment VIII. a b = 50 s/mm2 DW SS EPI image. b b = 800 s/mm2 DW SS EPI image. c Corresponding ADC map. Double echo TSE images: d TR/TE 3,000/84 ms, e TR/TE 3,000/228 ms. On DW images (b = 50, b = 800) the cavity of the first abscess (arrow) displays high signal intensity, which markedly decreases on ADC map, representing restricted diffusion (ADC value of 0.94 × 10−3 mm2/s—false positive diagnosis of malignancy). The cavity of the second abscess (arrowhead) shows increased signal on b = 50 DW image, mixed on b = 800 DW image and mostly increased on ADC map (ADC value of 1.27 × 10−3 mm2/s in the range of those of benign lesions). On axial T2-weighted images obtained with TE of 84 ms (d) and 228 ms (e) increased signal in noted in both cavities corresponding to relative long T2 times of 293 ms and 238 ms, typical for benign lesions. Abscesses demonstrate typical peripheral capsular enhancement on portal phase 3D GRE axial image (f)

References

    1. Coenegrachts K, De Geeter F, ter Beek L, et al. Comparison of MRI (including SS SE-EPI and SPIO-enhanced MRI) and FDG-PET/CT for the detection of colorectal liver metastases. Eur Radiol. 2009;19:370–379. doi: 10.1007/s00330-008-1163-y. - DOI - PubMed
    1. Vandecaveye V, De Keyzer F, Verslype C, et al. Diffusion-weighted MRI provides additional value to conventional dynamic contrast-enhanced MRI for detection of hepatocellular carcinoma. Eur Radiol. 2009;19:2456–2466. doi: 10.1007/s00330-009-1431-5. - DOI - PubMed
    1. Xu PJ, Yan FH, Wang JH, Lin J, Ji Y. Added value of breathhold diffusion-weighted MRI in detection of small hepatocellular carcinoma lesions compared with dynamic contrast-enhanced MRI alone using receiver operating characteristic curve analysis. J Magn Reson Imaging. 2009;29:341–349. doi: 10.1002/jmri.21650. - DOI - PubMed
    1. Chandarana H, Taouli B. Diffusion-weighted MRI and liver metastases. Magn Reson Imaging Clin N Am. 2010;18:451–464. doi: 10.1016/j.mric.2010.07.001. - DOI - PubMed
    1. Hammerstingl R, Huppertz A, Breuer J, et al. European EOB-study group. Diagnostic efficacy of gadotrexid acid (Primovist)-enhanced MRI and spiral CT for a therapeutic strategy: comparison with intraoperative and histopathologic findings in focal liver lesions. Eur Radiol. 2010;18:457–467. doi: 10.1007/s00330-007-0716-9. - DOI - PubMed

Publication types

MeSH terms