

Factors influencing the degree of enhancement of prostate cancer on contrast-enhanced transrectal ultrasonography: correlation with biopsy and radical prostatectomy specimens
- PMID: 22700257
- PMCID: PMC3500821
- DOI: 10.1259/bjr/63794331
Factors influencing the degree of enhancement of prostate cancer on contrast-enhanced transrectal ultrasonography: correlation with biopsy and radical prostatectomy specimens
Abstract
Objectives: This study was designed to identify factors that influenced the degree of enhancement of prostate cancer on contrast-enhanced transrectal ultrasonography (CETRUS).
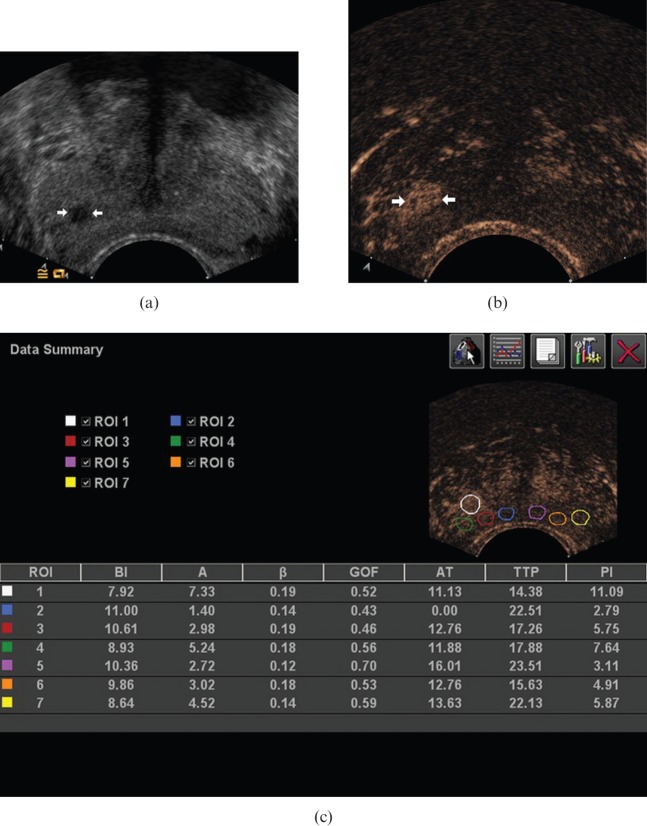
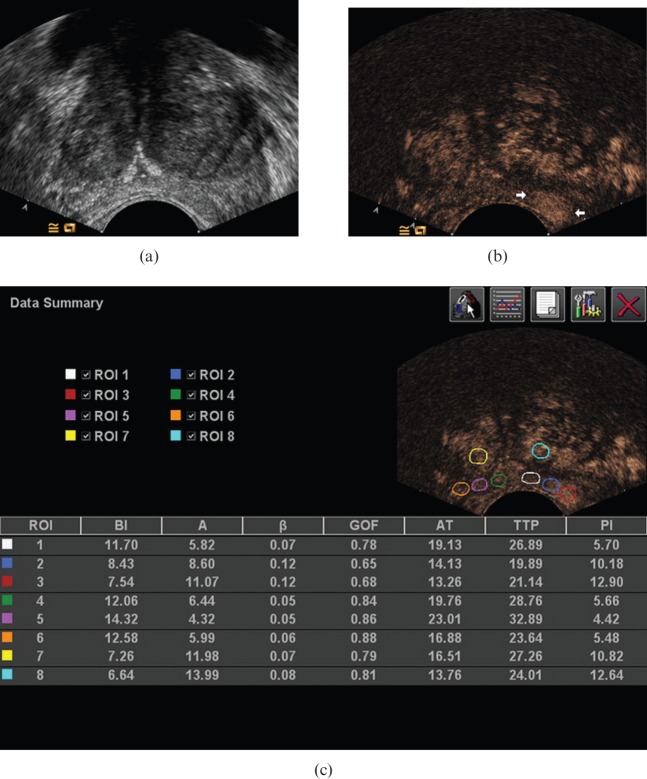
Methods: 139 patients suspected of prostate cancer were evaluated with CETRUS followed by systematic and targeted transrectal ultrasound-guided biopsies. The degree of enhancement of the lesions was objectively measured using peak intensity with time-intensity curve analysis software. Ultrasound findings were correlated with clinical characteristics as well as biopsy and radical prostatectomy findings.
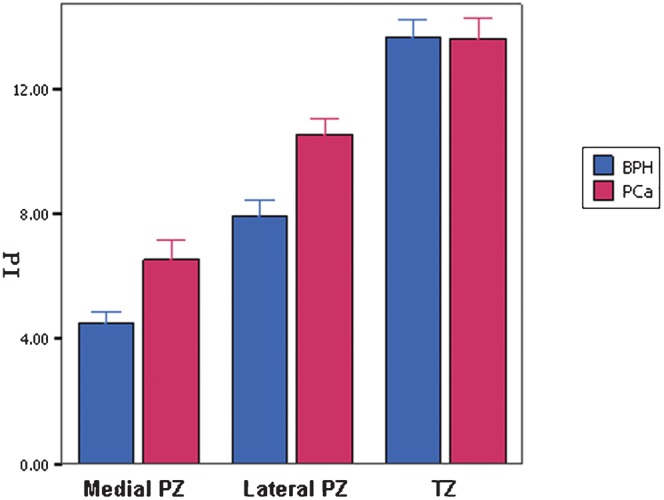
Results: Prostate cancers were detected in 230 biopsy sites from 91 patients. The mean peak intensity value of prostate cancer was significantly higher than that of the benign lesions (9.82 ± 3.73 vs 7.51 ± 2.97; p<0.001), and the peak intensity value of the cancer foci varied across the prostate. The mixed model analysis revealed that the location and Gleason score of tumour foci were the influencing factors of the peak intensity value, and the former had a stronger influence upon peak intensity than the latter (p=0.000 and 0.040, respectively). However, age, prostate volume or serum prostate-specific antigen of the patient had no significant influence on the peak intensity value (p>0.05). Furthermore, the peak intensity value of tumours larger than 5 mm diameter was significantly higher than tumours of 5 mm or smaller diameter (9.28 ± 2.46 vs 6.69 ± 2.65; p<0.001).
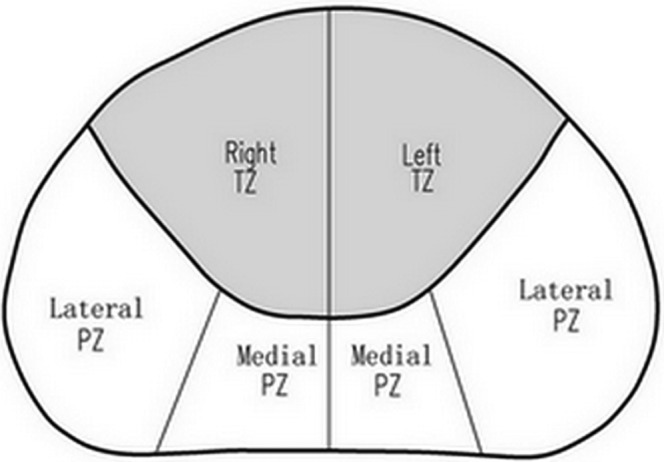
Conclusions: The prostate cancer lesions with a higher Gleason score and larger tumour size which were located in the lateral peripheral zone (PZ) were more likely to show a marked enhancement. Lesions with lower peak intensity that are located in the medial PZ should also be treated as suspicious.
Figures
Similar articles
-
Enhancement characteristics of benign and malignant focal peripheral nodules in the peripheral zone of the prostate gland studied using contrast-enhanced transrectal ultrasound.Clin Radiol. 2008 Oct;63(10):1086-91. doi: 10.1016/j.crad.2007.11.026. Epub 2008 Apr 25. Clin Radiol. 2008. PMID: 18774354
-
Detection of significant prostate cancer with magnetic resonance targeted biopsies--should transrectal ultrasound-magnetic resonance imaging fusion guided biopsies alone be a standard of care?J Urol. 2015 Apr;193(4):1198-204. doi: 10.1016/j.juro.2014.11.002. Epub 2014 Nov 11. J Urol. 2015. PMID: 25451824
-
Contrast-enhanced transrectal ultrasound for assessing vascularization of hypoechoic BPH nodules in the transition and peripheral zones: comparison with pathological examination.Ultrasound Med Biol. 2008 Nov;34(11):1758-64. doi: 10.1016/j.ultrasmedbio.2008.04.009. Epub 2008 Jun 4. Ultrasound Med Biol. 2008. PMID: 18524461
-
Multiparametric MRI in detection and staging of prostate cancer.Dan Med J. 2017 Feb;64(2):B5327. Dan Med J. 2017. PMID: 28157066 Review.
-
[Endosonography of the prostate].Urologe A. 1991 Nov;30(6):370-7. Urologe A. 1991. PMID: 1722920 Review. German.
Cited by
-
Clinical application of contrast enhanced ultrasound to diagnose benign prostatic hyperplasia.Diagn Pathol. 2014 Jul 1;9:133. doi: 10.1186/1746-1596-9-133. Diagn Pathol. 2014. Retraction in: Diagn Pathol. 2015 Mar 26;10:10. doi: 10.1186/s13000-015-0240-1. PMID: 24986664 Free PMC article. Retracted.
-
Transrectal Ultrasound and Photoacoustic Imaging Probe for Diagnosis of Prostate Cancer.Sensors (Basel). 2021 Feb 9;21(4):1217. doi: 10.3390/s21041217. Sensors (Basel). 2021. PMID: 33572287 Free PMC article.
-
Additional Midline Biopsies of the Peripheral Zone Associated with the First Endorectal Standard Sextant Pattern Improves the Accuracy of Prostate Cancer Detection in Japanese Patients.Curr Urol. 2015 Jul;8(2):74-8. doi: 10.1159/000365693. Epub 2015 Jul 10. Curr Urol. 2015. PMID: 26889121 Free PMC article.
-
Contrast-enhanced transrectal ultrasound for prediction of prostate cancer aggressiveness: The role of normal peripheral zone time-intensity curves.Sci Rep. 2016 Dec 8;6:38643. doi: 10.1038/srep38643. Sci Rep. 2016. PMID: 27929134 Free PMC article.
-
Machine learning based on radiomics features combing B-mode transrectal ultrasound and contrast-enhanced ultrasound to improve peripheral zone prostate cancer detection.Abdom Radiol (NY). 2024 Jan;49(1):141-150. doi: 10.1007/s00261-023-04050-5. Epub 2023 Oct 5. Abdom Radiol (NY). 2024. PMID: 37796326 Free PMC article.
References
-
- Jemal A, Siegel R, Xu J, Ward E. Cancer statistics, 2010. CA Cancer J Clin 2010;60:277–300 - PubMed
-
- Pallwein L, Mitterberger M, Pelzer A, Bartsch G, Strasser H, Pinggera GM, et al. Ultrasound of prostate cancer: recent advances. Eur Radiol 2008;18:707–15 - PubMed
-
- Spencer JA, Alexander AA, Gomella L, Matteucci T, Goldberg BB. Clinical and US findings in prostate cancer: patients with normal prostate-specific antigen levels. Radiology 1993;189:389–93 - PubMed
-
- Halpern EJ, Strup SE. Using gray-scale and color and power Doppler sonography to detect prostatic cancer. AJR Am J Roentgenol 2000;174:623–7 - PubMed
Publication types
MeSH terms
Substances
LinkOut - more resources
Full Text Sources
Medical
