. 2012 Jun;35(3):217-27.
doi: 10.1007/s13402-012-0081-9. Epub 2012 Jun 15.

Alterations of monocarboxylate transporter densities during hypoxia in brain and breast tumour cells

Affiliations

Alterations of monocarboxylate transporter densities during hypoxia in brain and breast tumour cells

Chang Cheng et al. Cell Oncol (Dordr). 2012 Jun.

Abstract

Background: Tumour cells are characterized by aerobic glycolysis, which provides biomass for tumour proliferation and leads to extracellular acidification through efflux of lactate via monocarboxylate transporters (MCTs). Deficient and spasm-prone tumour vasculature causes variable hypoxia, which favours tumour cell survival and metastases. Brain metastases frequently occur in patients with advanced breast cancer.Effective treatment strategies are therefore needed against brain metastasis from breast carcinoma.

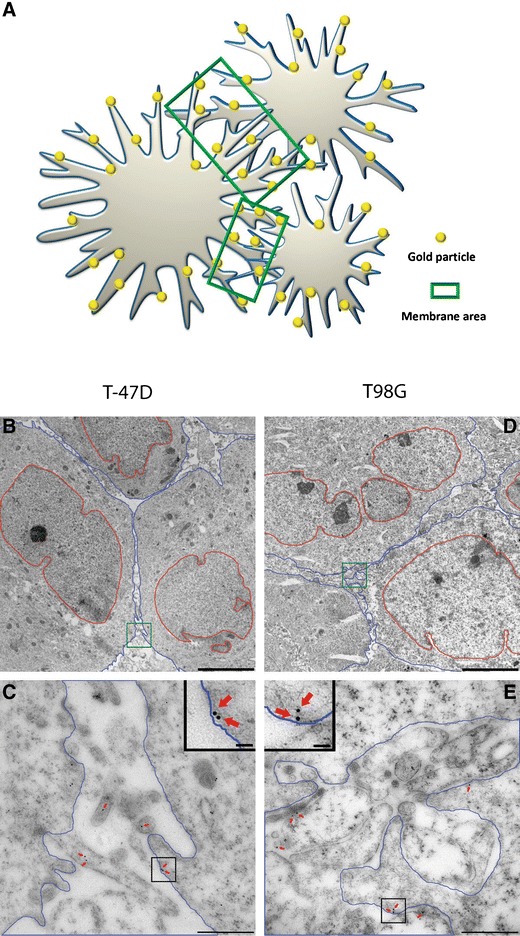
Material and methods: In order to identify differences in the capacity for lactate exchange, human T-47D breast cancer cells and human glioblastoma T98G cells were grown under 4 % or 20 % oxygen conditions and examined for MCT1, MCT2 and MCT4 expression on plasma membranes by quantitative post embedding immunogold electron microscopy. Whereas previous studies on MCT expression in tumours have recorded mRNA and protein levels in cell extracts, we examined concentrations of the proteins in the microvillous plasma membrane protrusions specialized for transmembrane transport.

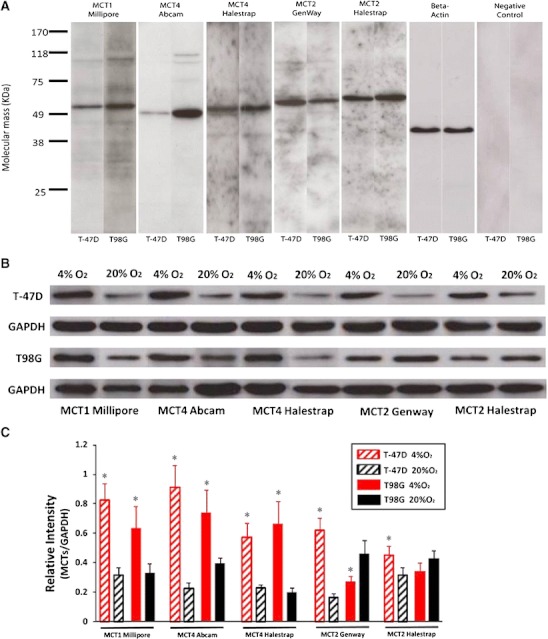
Results: In normoxia, both tumour cell types highly expressed the low affinity transporter MCT4, which is thought to mainly mediate monocarboxylate efflux, while for high affinity transport the breast tumour cells preferentially expressed MCT1 and the brain tumour cells resembled brain neurons in expressing MCT2, rather than MCT1. The expressions of MCT1 and MCT4 were upregulated in hypoxic conditions in both breast and brain tumour cells. The expression of MCT2 also increased in hypoxic breast cancer cells, but decreased in hypoxic brain tumour cells. Quantitative immunoblots showed similar hypoxia induced changes in the protein levels.

Conclusion: The differential expression and regulation of MCTs in the surface membranes of hypoxic and normoxic tumour cells of different types provide a foundation for innovation in tumour therapy through the selective targeting of MCTs. Selective inhibition of various MCTs could be an efficient way to quench an important energy source in both original breast tumour and metastatic cancer tissue in the brain.


Figures

Fig. 1
Fig. 1
Electron micrographs of membrane area. a Illustration of the tumour cells (grey), gold particles (yellow) and membrane area (green). b Low magnification transmission electron micrograph from T-47D cells. c High magnification from (b) green square, cell membrane region. d Low magnification from T98G cells. e High magnification from (d) green square. The morphology is characteristic of tumour cells with nuclear atypia. The area between plasma membranes of two cells is covered with microvillous processes extended from the cell surface. Blue area, cell body; Blue lines, cell membranes; Red lines, nuclear membranes; Green square, membrane area; Scale bars, 5 μm in B and D, 500 nm in C and E; insets, 50 nm in C and E
Fig. 2
Fig. 2
T-47D and T98G cells were grown either in 20 % or 4 % oxygen. The medium was changed on day 2. a The change in pericellular oxygen concentration as cell number increases between reseedings in cells flasks cultured with 4 % oxygen in the gas phase. Results from one representative experiment are shown. b T-47D cells and T98G cells were seeded at numbers resulting in full but not confluent flasks at day 4 for the MCT analysis. In addition measurements of lactate, glucose and pH were done in flasks with the same number of T98G cell as T-47D cells. c The cellular mass calculated from the cell volume and cell numbers from panel b. Panels df show the data after the medium change. d Glucose concentration (black square shows measurement of medium). e Lactate concentration (black square shows measurement of medium). f pH. Error bars show standard error of the mean from two parallel flasks
Fig. 3
Fig. 3
Antibody specificity and MCT protein quantification. a Immunoblots from T98G tumour cells and T-47D cancer cells gave for all antibodies single bands at a molecular weight of approximately 49–58 KD for MCT1 M (55 KD), MCT2 G (58 KD), MCT2 H (60 KD), MCT4 A (49 KD) and MCT4 H (52 KD). The results are consistent with the molecular mass of the proteins and the descriptions from the antibody suppliers. b The immunoreactive bands show the expression of each MCT in hypoxia and normoxia, in T-47D and T98G tumour cells. c The level of MCT1, MCT4 and MCT2 increased in T-47D cells after hypoxic cultivation, whereas a significant MCT2 expression decrease was detected in hypoxic T98G cells. Error bars show standard error of the mean. The asterisk indicates a statistically significant difference (P < 0.05) between hypoxia and normoxia
Fig. 4
Fig. 4
The density of MCTs on plasma membranes and cytoplasm. The density of MCTs on the membranes of hypoxic tumour cells and normoxic cells were significantly higher than that on cytoplasm areas without mitochondria areas. a–c The MCT1 and MCT4 density on membranes of hypoxic cells was significantly higher than that of normoxic cells in both T-47D and T98G cells. d–e The MCT2 density of T-47D hypoxic cells was significantly higher than that of normoxic cells. For T98G cells, it is the reverse. Error bars show standard error of the mean. Asterisks indicate statistically significant differences (p < 0.05) between hypoxia and normoxia
Fig. 5
Fig. 5
Electronic micrographs from T-47D and T98G cells with different MCTs. In electron micrographs, gold particles signalled immunoreactivity to MCT. To quantify the labelling of different transporter subtypes, the area between two cells creating a border region was calculated and gold particles (red arrows) situated in the region, including 25 nm on each side of the membranes (approximately the same distance as the lateral resolution of the immunogold method (Bergersen et al. 2008)), were marked by ImageJ software. The density of transporters’ immunoreactivity in the region containing microvillous processes of the surface membrane was calculated as the number of gold particles divided by the area. Red arrows, gold particles; Scale bars, 500 nm; insets, 100 nm

Similar articles

Cited by

References

    1. Arslan UY, Oksuzoglu B, Aksoy S, Harputluoglu H, Turker I, Ozisik Y, Dizdar O, Altundag K, Alkis N, Zengin N. Breast cancer subtypes and outcomes of central nervous system metastases. Breast. 2011;20:562–567. doi: 10.1016/j.breast.2011.07.017. - DOI - PubMed
    1. Warburg O. On respiratory impairment in cancer cells. Science. 1956;124:269–270. - PubMed
    1. Warburg O. On the origin of cancer cells. Science. 1956;123:309–314. doi: 10.1126/science.123.3191.309. - DOI - PubMed
    1. Vander Heiden MG, Cantley LC, Thompson CB. Understanding the Warburg effect: the metabolic requirements of cell proliferation. Science. 2009;324:1029–1033. doi: 10.1126/science.1160809. - DOI - PMC - PubMed
    1. Vander Heiden MG, Locasale JW, Swanson KD, Sharfi H, Heffron GJ, Amador-Noguez D, Christofk HR, Wagner G, Rabinowitz JD, Asara JM, Cantley LC. Evidence for an alternative glycolytic pathway in rapidly proliferating cells. Science. 2010;329:1492–1499. doi: 10.1126/science.1188015. - DOI - PMC - PubMed

Publication types

MeSH terms