. 2012:872:191-204.
doi: 10.1007/978-1-61779-797-2_13.

The use of fluorescent proteins for developing cancer-specific target imaging probes

Affiliations

The use of fluorescent proteins for developing cancer-specific target imaging probes

Thomas E McCann et al. Methods Mol Biol. 2012.

Abstract

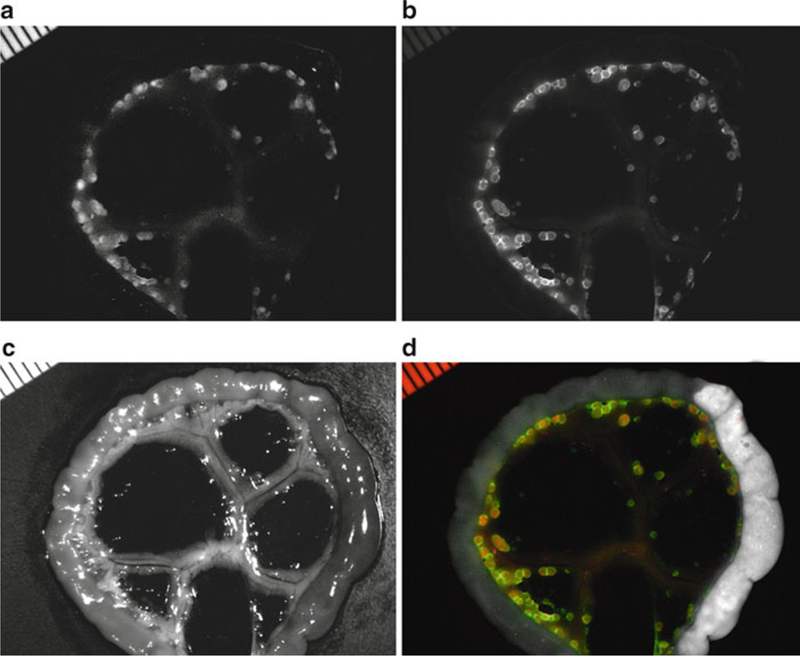
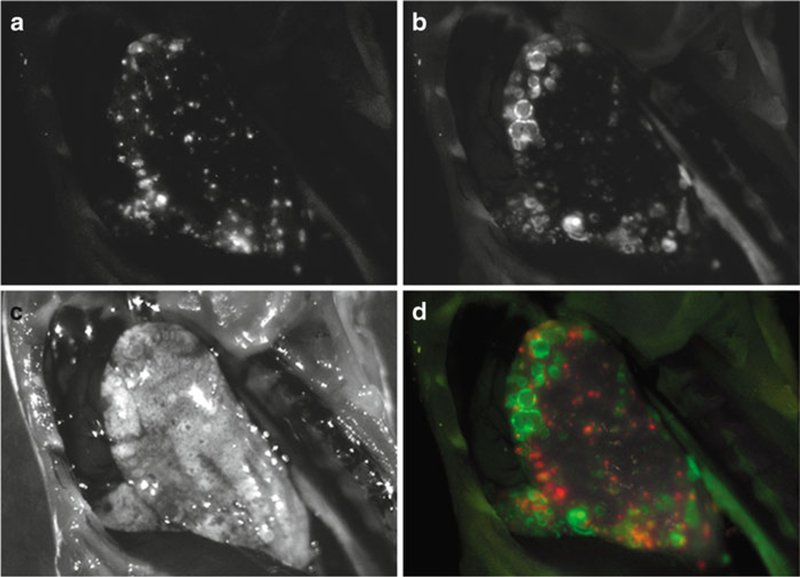
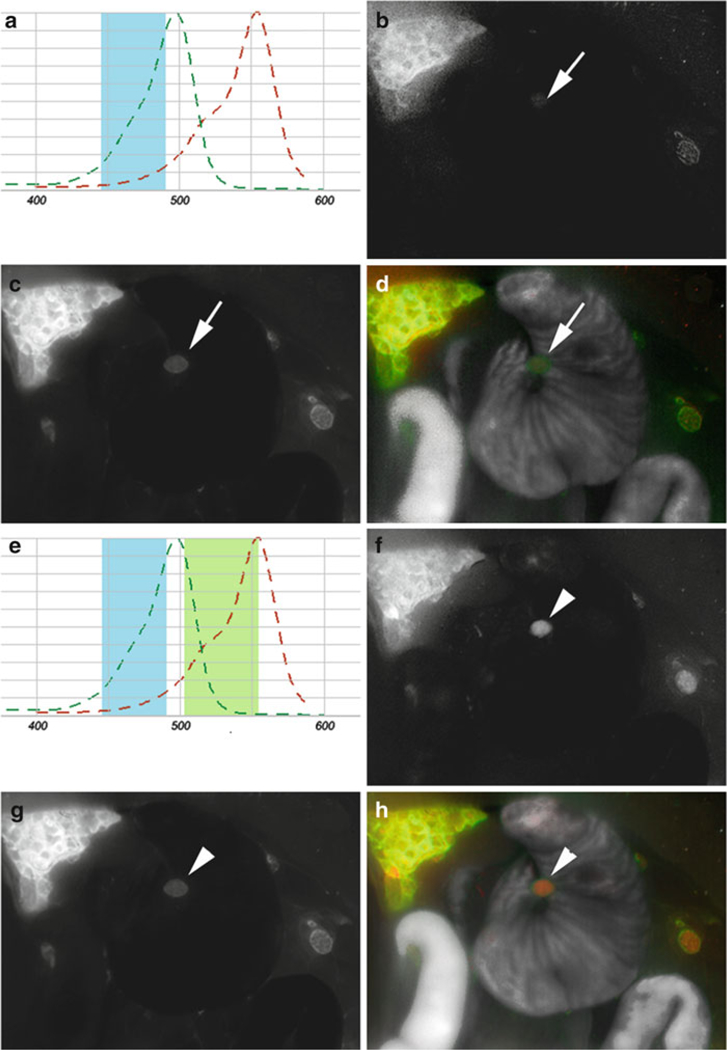
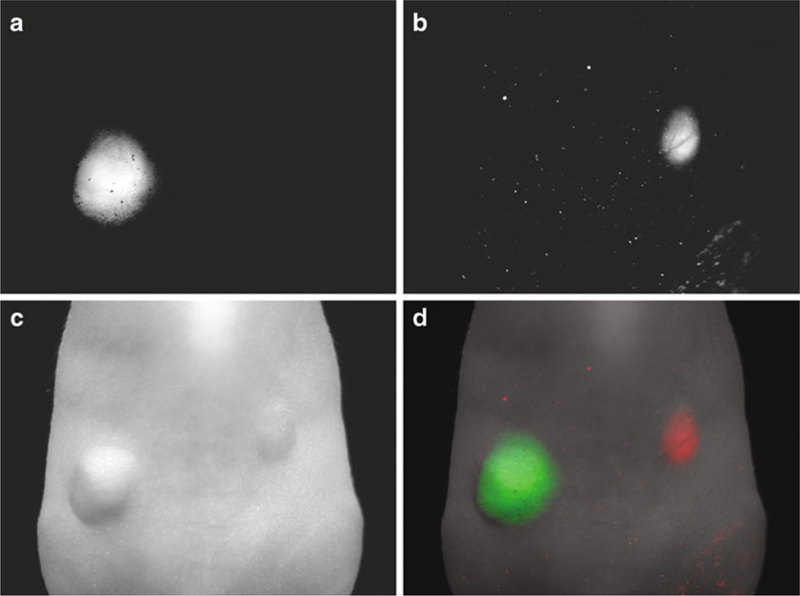
Target-specific imaging probes represent a promising tool in the molecular imaging of human cancer. Fluorescently-labeled target-specific probes are useful in imaging cancers because of their ability to bind a target receptor with high sensitivity and specificity. The development of probes relies upon preclinical testing to validate the sensitivity and specificity of these agents in animal models. However, this process involves both conventional histology and immunohistochemistry, which require large numbers of animals and samples with costly handling. In this chapter, we describe a novel validation tool that takes advantage of genetic engineering technology, whereby cell lines are transfected with genes that induce the target cell to produce fluorescent proteins with characteristic emission spectra, thus enabling their easy identification as cancer cells in vivo. Combined with multicolor fluorescence imaging, this can provide rapid validation of newly-developed exogenous probes that fluoresce at different wavelengths. For example, the plasmid containing the gene encoding red fluorescent protein (RFP) was transfected into cell lines previously developed to either express or not express specific cell surface receptors. Various antibody-based or ligand-based optical-contrast agents, with green fluorophores were developed to concurrently target cancer cells and validate their positive and negative controls, such as the β-D: -galactose receptor, HER1, and HER2 in a single animal/organ. Spectrally-resolved multicolor fluorescence imaging was used to detect separate fluorescence emission spectra from the exogenous green fluorophore and RFP. Here, we describe the use of "co-staining" (matching the exogenous fluorophore and the endogenous fluorescent protein to the positive control cell line) and "counter-staining" (matching the exogenous fluorophore to the positive control and the endogenous fluorescent protein to the negative control cell line) to validate the sensitivity and specificity of target-specific probes. Using these in vivo imaging techniques, we are able to determine the sensitivity and specificity of target-specific optical contrast agents in several distinct animal models of cancer in vivo, thus exemplifying the versatility of our technique, while reducing the number of animals needed to conduct these experiments.


Figures

Fig. 1.
Fig. 1.
Co-staining in a peritoneal-dissemination model of ovarian cancer. Spectral fluorescence images of a SHIN3-RFP tumor-bearing mouse which was injected with GmSA-RhodG. Unmixed spectral fluorescence images display (a) SHIN3-RFP tumors in the RFP spectrum and (b) the tested imaging probe (GmSA-RhodG) in the RhodG spectrum. (c) White light image of gut and mesentery. (d) Overlay of spectral images illustrates the co-localization of both the RFP and RhodG fluorescence.
Fig. 2.
Fig. 2.
Counter staining in a model of lung metastasis. Spectral-fluorescence images of a mouse bearing 3T3-HER2 (HER2+) and Balb3T3-RFP (HER2-) tumors in a lung metastasis model that was injected with RhodG-conjugated trastuzumab (anti-HER2). (a) Unmixed RFP spectral image localizes RFP tumors. (b) Unmixed RhodG spectral image identifies 3T3-HER2 tumors labeled with trastuzumab-RhodG. (c) White light images of the left lung. (d) Two-color spectral-fluorescence overlay localizes HER2+ and HER2- tumors which are clearly differentiated from each other and do not co-localize.
Fig. 3.
Fig. 3.
Comparison of single- and multi-excitation in a peritoneal-dissemination model of ovarian cancer. (a) Schematic of RFP (red) and RhodG (green) absorbance curves, and range of single blue excitation light (blue). The blue light adequately excites RhodG, but only suboptimally excites RFP. (b-d) Spectral fluorescence images taken with a single excitation blue light using a co-staining method in a SHIN3-RFP-tumor-bearing mouse receiving GmSA-RhodG. (b) RFP spectrum identifies endogenous expression of RFP by SHIN3 cells but is unable to recognize tumor nodules (arrowS) that are visible on the RhodG spectrum (c). (d) Two-color overlay using single excitation light. (e) Schematic of multi-excitation (blue and green) light on the absorbance curves of RFP (red) and RhodG (green) demonstrating more efficient excitation of RFP by green light. (f-h) Spectral-fluorescence images, taken with multiple-excitation filters in the same mouse, demonstrates the ability to identify the previously-invisible tumor nodules on the RFP spectrum (f, arrowhead) that are still present on the RhodG spectrum (g). (h) Two-color overlay using multiple excitation filters.
Fig. 4.
Fig. 4.
Subcutaneous-xenograft model identified with counter-staining. Spectral-fluorescence images of a mouse bearing ATAC4 (IL-2Rα+) and A431-RFP (IL-2Rα-) tumors receiving ICG-conjugated daclizumab (anti-IL-2Rα). Unmixed spectral fluorescence images illustrate (a) the ICG spectrum demonstrating the localization of ATAC4 tumors labeled with ICG conjugated daclizumab, (b) the RFP spectrum localizing A431 cells endogenously expressing RFP. (c) White light image, and (d) two-color overlay demonstrates that ATAC4 tumor (IL-2Rα+) is depicted only in the ICG spectrum (green), while a A431-RFP tumor is depicted only in the RFP spectrum (red) and does not show any fluorescence in ICG spectrum.

References

    1. Hama Y, Urano Y, Koyama Y, Kamiya M, Bernardo M, Paik RS, et al. (2006) In vivo spectral fluorescence imaging of submillimeter peritoneal cancer implants using a lectin- targeted optical agent. Neoplasia 8(7), 607–612. - PMC - PubMed
    1. Kobayashi K, Hama Y, Koyama Y, Barrett T, Urano Y, Choyke P (2007) Whole-body multicolor spectrally resolved fluorescence imaging for development of target-specific optical contrast agents using genetically engineered probes. Proc SPIE 6449, 644914.
    1. Hama Y, Urano Y, Koyama Y, Choyke PL, Kobayashi H (2007) d-galactose receptor-targeted in vivo spectral fluorescence imaging of peritoneal metastasis using galactosamine-conjugated serum albumin-rhodamine green. JBiomed Opt 12(5), 051501. - PubMed
    1. Longmire M, Kosaka N, Ogawa M, Choyke PL, Kobayashi H (2009) Multicolor in vivo targeted imaging to guide real-time surgery of HER2-positive micrometastases in a two-tumor coincident model of ovarian cancer. Cancer Sci 100(6), 1099–1104. - PMC - PubMed
    1. Ogawa M, Kosaka N, Choyke PL, Kobayashi H (2009) In vivo molecular imaging of cancer with a quenching near-infrared fluorescent probe using conjugates of monoclonal antibodies and indocyanine green. Cancer Res 69(4), 1268–1272. - PMC - PubMed