. 2012 Aug;26(8):1443-54.
doi: 10.1210/me.2011-1382. Epub 2012 Jun 14.

Research resource: Diagnostic and therapeutic potential of nuclear receptor expression in lung cancer

Affiliations

Research resource: Diagnostic and therapeutic potential of nuclear receptor expression in lung cancer

Yangsik Jeong et al. Mol Endocrinol. 2012 Aug.

Abstract

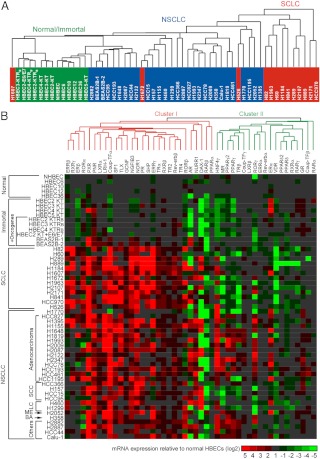
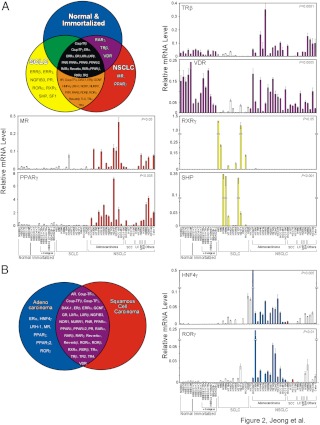
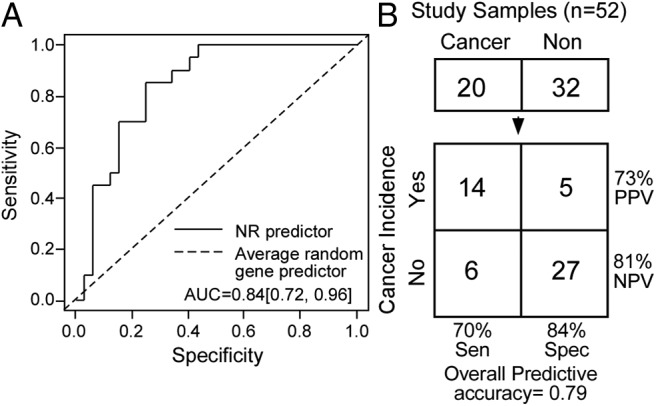
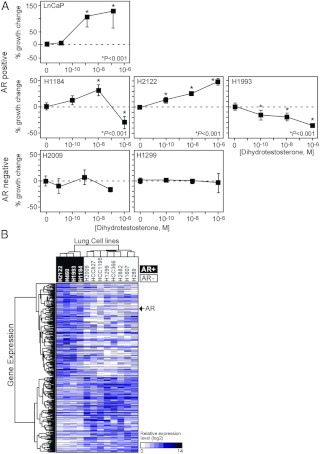
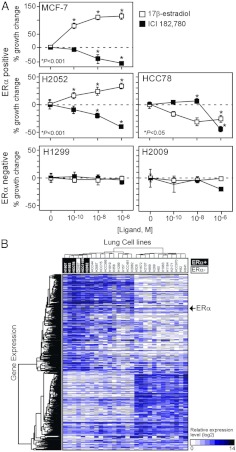
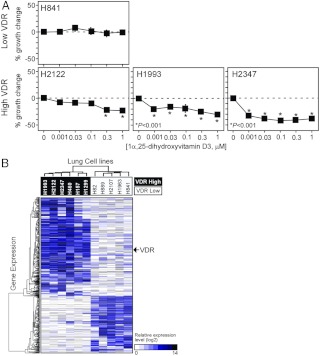
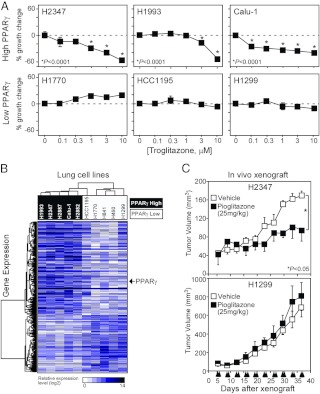
Lung cancer is the leading cause of cancer-related death. Despite a number of studies that have provided prognostic biomarkers for lung cancer, a paucity of reliable markers and therapeutic targets exist to diagnose and treat this aggressive disease. In this study we investigated the potential of nuclear receptors (NRs), many of which are well-established drug targets, as therapeutic markers in lung cancer. Using quantitative real-time PCR, we analyzed the expression of the 48 members of the NR superfamily in a human panel of 55 normal and lung cancer cell lines. Unsupervised cluster analysis of the NR expression profile segregated normal from tumor cell lines and grouped lung cancers according to type (i.e. small vs. non-small cell lung cancers). Moreover, we found that the NR signature was 79% accurate in diagnosing lung cancer incidence in smokers (n = 129). Finally, the evaluation of a subset of NRs (androgen receptor, estrogen receptor, vitamin D receptor, and peroxisome proliferator-activated receptor-γ) demonstrated the therapeutic potential of using NR expression to predict ligand-dependent growth responses in individual lung cancer cells. Preclinical evaluation of one of these receptors (peroxisome proliferator activated receptor-γ) in mouse xenografts confirmed that ligand-dependent inhibitory growth responses in lung cancer can be predicted based on a tumor's receptor expression status. Taken together, this study establishes NRs as theragnostic markers for predicting lung cancer incidence and further strengthens their potential as therapeutic targets for individualized treatment.


Figures

Fig. 1.
Fig. 1.
NR gene expression signature in lung cancer cell lines. A, Unsupervised cluster analysis for 55 lung cell lines using the NR QPCR mRNA expression data. Colors depict immortalized and normal HBEC (green), SCLC (red), and NSCLC (blue) cell lines. B, Heat map of relative NR expression in lung cancer cell lines. Expression values for each NR were normalized to the average receptor value (arbitrarily set to 1) obtained from the five normal HBEC cell lines. Red and green colors represent values that were higher or lower, respectively, than the average value observed in the normal HBEC. The horizontal axis shows unsupervised clustering of 47 NRs (including the alternative splice variants for PPARγ and PPARδ), and the vertical axis displays the 55 lung cell lines ordered based on their pathological classification. ME, Mesothelioma; BA, bronchioalveolar. Constitutive androstane receptor, farnesoid X receptor, and HNF4α were not included due to their low expression (Ct > 34). The scale represents log 2 ratio of the normalized NR expression values.
Fig. 2.
Fig. 2.
Classification of tumor types based on NR expression. A, Distribution of NRs in normal and immortalized, SCLC, and NSCLC. The subsets of NRs were grouped in the Venn diagram based on their expression pattern using the statistical U test. The panels display representative NR expression profiles for each class identified in the Venn diagram. Constitutive androstane receptor, farnesoid X receptor, and HNF4α were not included due to their low expression (Ct > 34). B, Distribution of NRs in adenocarcinoma and squamous cell carcinoma cells are depicted in the Venn diagram using the statistical U test. The panels display representative NRs expression profiles that distinguish adenocarcinoma cells. Constitutive androstane receptor, ERRβ, ERRγ, farnesoid X receptor, HNF4α, pregnane X receptor, retinoid X receptor-γ, steroidogenic factor 1, SHP, and TLX were excluded due to their low expression (Ct > 34) in these two groups of cell lines.
Fig. 3.
Fig. 3.
The NR gene signature as a biomarker for lung cancer incidence in smokers. A, Receiving operation curve analysis using the NR gene expression signature from 129 smokers. NR lung expression data from the microarray data sets (accession no. GSE 4115) for these patients were trained in one set (n = 77) and validated in an independent testing set (n = 52). A, The 95% confidence interval for the area under the curve (AUC) is 0.84 (0.72, 0.96). B, Diagnostic utility of the NR gene signature. The NR gene signature showed a diagnostic sensitivity of 70% (14 of 20 cancer cases) with only a 16% false-positive rate (five of 32 noncancer cases). This analysis revealed a prediction accuracy of 79% for lung cancer incidence in tested smokers. Cancer and Non indicate patients with and without cancer, respectively. Cancer incidence indicates the predicted cancer diagnosis based on the NR signature. Sens, Sensitivity; Spec, specificity; PPV, positive predictive value; NPV, negative predictive value.
Fig. 4.
Fig. 4.
Evaluation of AR in lung cancer cells. A, Lung cancer cell growth response to DHT treatment. Relative growth responses were assessed as described in Materials and Methods. Asterisks show the statistically significant points evaluated by ANOVA. B, Hierarchical clustering of AR-dependent gene signatures and lung cancer cells. A genetic signature of 380 genes showing more than a 2-fold difference between AR-positive and AR-negative lung cancer cells was used for the cluster analysis using Matrix 1.29.
Fig. 5.
Fig. 5.
Evaluation of ERα in lung cancer cells. A, Lung cancer cell growth response to ERα ligands. Relative growth responses were assessed as described in Materials and Methods. Asterisks show the statistically significant points evaluated by ANOVA. B, Hierarchical clustering of ERα-dependent gene signatures and lung cancer cells. A genetic signature of 540 genes showing more than a 2-fold difference between ERα-positive and ERα-negative lung cancer cells was performed as in Fig. 4.
Fig. 6.
Fig. 6.
Evaluation of VDR in lung cancer cells. A, Lung cancer cell growth response to 1α, 25-dihydroxyvitamin D3. Relative growth responses were assessed as described in Materials and Methods. Asterisks show the statistically significant points evaluated by ANOVA. B, Hierarchical clustering of VDR-dependent gene signatures and lung cancer cells. A genetic signature of 717 genes showing more than an 8-fold difference between VDR-positive and VDR-negative lung cancer cells was performed as in Fig. 4.
Fig. 7.
Fig. 7.
Evaluation of PPARγ in lung cancer cells and tumors. A, Lung cancer cell growth response to troglitazone. Relative growth responses were assessed as described in Materials and Methods. Asterisks show the statistically significant points evaluated by ANOVA. B, Hierarchical clustering of PPARγ-dependent gene signatures and lung cancer cells. A genetic signature of 1010 genes showing more than a 2-fold difference between PPARγ-positive and PPARγ-negative lung cancer cells was performed as in Fig. 4. C, Response of PPARγ-positive and PPARγ-negative xenograft lung cancer tumors to pioglitazone. H1299 and H2347 cells were sc injected into athymic nude mice and allowed to form tumors. Mice were treated with 25 mg/kg pioglitazone or vehicle control four times a week (indicated on the x-axis). Tumor volumes were measured twice a week. Tumor volume represents the tumor size (n = 4 per group) ± sem and statistical analysis determined using a Student t test.

Similar articles

Cited by

References

    1. Jemal A, Siegel R, Xu J, Ward E. 2010. Cancer statistics, 2010. CA Cancer J Clin 60:277–300 - PubMed
    1. Bhattacharjee A, Richards WG, Staunton J, Li C, Monti S, Vasa P, Ladd C, Beheshti J, Bueno R, Gillette M, Loda M, Weber G, Mark EJ, Lander ES, Wong W, Johnson BE, Golub TR, Sugarbaker DJ, Meyerson M. 2001. Classification of human lung carcinomas by mRNA expression profiling reveals distinct adenocarcinoma subclasses. Proc Natl Acad Sci USA 98:13790–13795 - PMC - PubMed
    1. Molina R, Augé JM, Bosch X, Escudero JM, Viñolas N, Marrades R, Ramírez J, Carcereny E, Filella X. 2009. Usefulness of serum tumor markers, including progastrin-releasing peptide, in patients with lung cancer: correlation with histology. Tumour Biol 30:121–129 - PubMed
    1. Raponi M, Zhang Y, Yu J, Chen G, Lee G, Taylor JM, Macdonald J, Thomas D, Moskaluk C, Wang Y, Beer DG. 2006. Gene expression signatures for predicting prognosis of squamous cell and adenocarcinomas of the lung. Cancer Res 66:7466–7472 - PubMed
    1. Spira A, Beane JE, Shah V, Steiling K, Liu G, Schembri F, Gilman S, Dumas YM, Calner P, Sebastiani P, Sridhar S, Beamis J, Lamb C, Anderson T, Gerry N, Keane J, Lenburg ME, Brody JS. 2007. Airway epithelial gene expression in the diagnostic evaluation of smokers with suspect lung cancer. Nat Med 13:361–366 - PubMed

Publication types

MeSH terms