. 2012 Aug;14(8):1037-49.
doi: 10.1093/neuonc/nos121. Epub 2012 Jun 14.

CD38 deficiency in the tumor microenvironment attenuates glioma progression and modulates features of tumor-associated microglia/macrophages

Affiliations

CD38 deficiency in the tumor microenvironment attenuates glioma progression and modulates features of tumor-associated microglia/macrophages

Ayelet Levy et al. Neuro Oncol. 2012 Aug.

Abstract

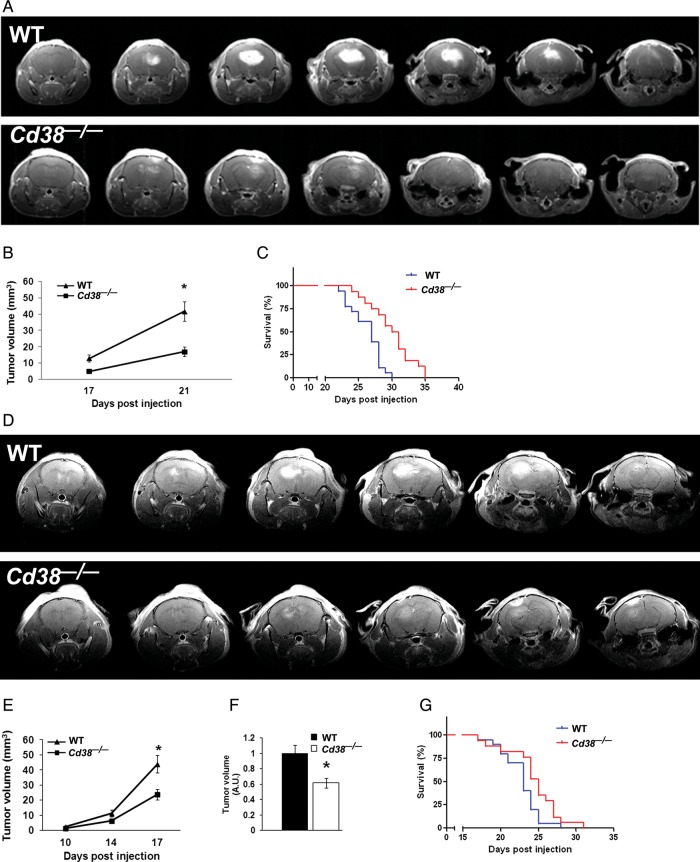
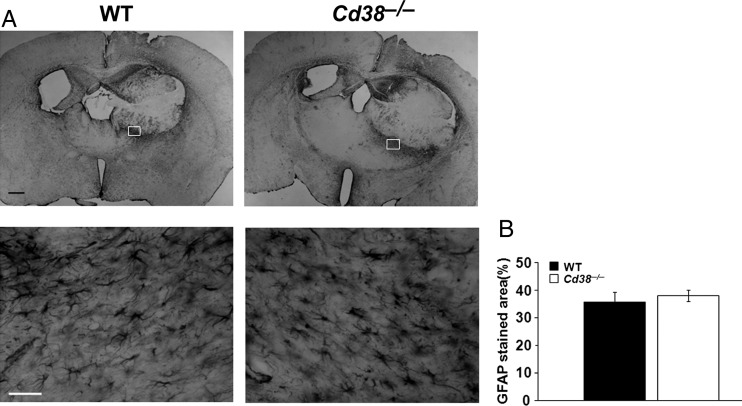
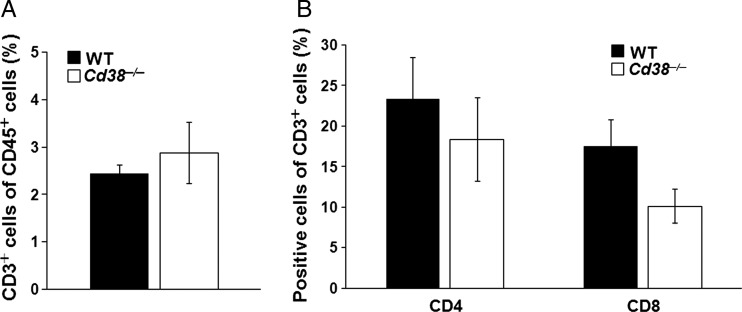
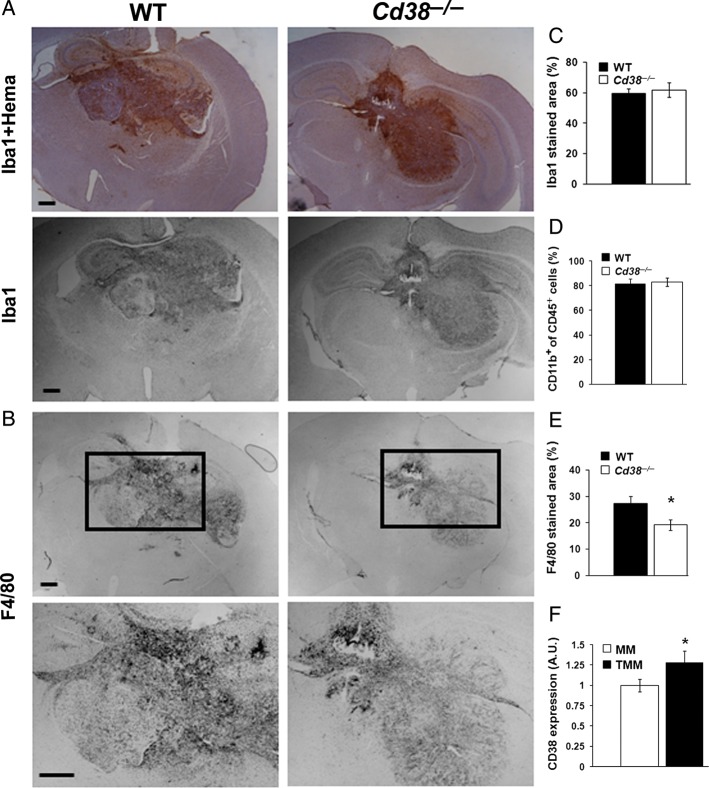
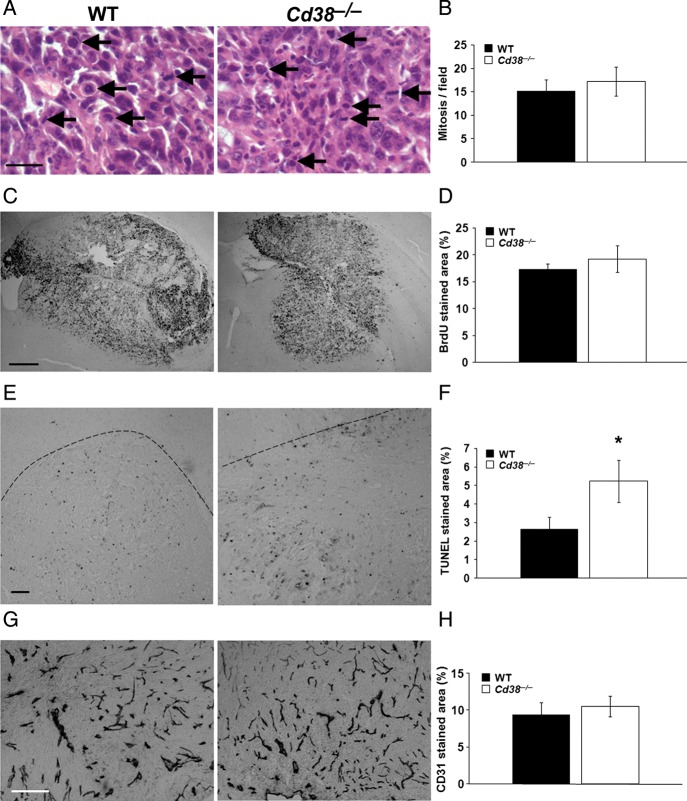
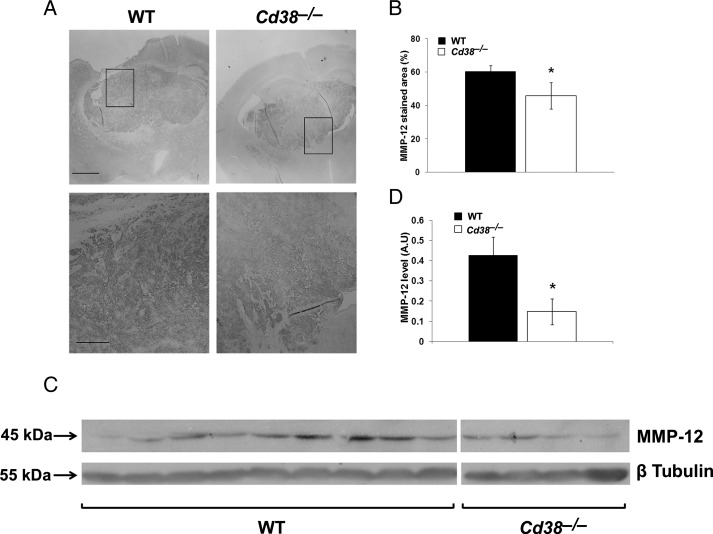
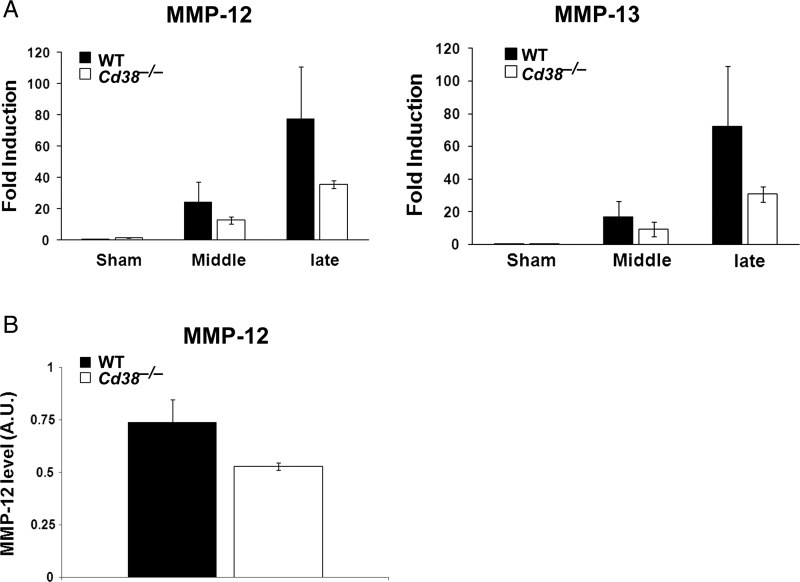
Gliomas are the most frequent primary tumors of the brain, and for highly malignant gliomas there is no successful treatment. The tumor microenvironment contains large numbers of infiltrating microglia and macrophages (MM). There is increasing evidence that the tumor-associated MM support glioma expansion. CD38 is a multifunctional ectoenzyme that uses nicotinamide adenine dinucleotide as a substrate to generate second messengers. Previously we showed that CD38 deficiency modulates microglial "activation" and impaired recovery from head trauma by a microglia-associated mechanism. In view of the supportive role of MM in glioma progression and the role of CD38 in microglia activation, we hypothesize that deficiency of CD38 in the tumor microenvironment would inhibit glioma progression. Using the syngeneic GL261 model of glioma progression in wild-type and CD38 null mice, we show here that CD38 deficiency significantly attenuates glioma expansion and prolongs the life span of the glioma-bearing mice. The CD38 deficiency effect was associated with increased cell death and decreased metalloproteinase-12 expression in the tumor mass, as well as modulation of the tumor-induced MM properties, as indicated by a reduction in the expression of the MM marker F4/80 and matrix metalloproteinases. Our results thus suggest that CD38 participates in the tumor-supporting action of MM and that targeting CD38 might be a potential therapeutic approach for glioma treatment.


Figures

Fig. 1.
Fig. 1.
CD38 deficiency reduces tumor volume and prolongs survival duration of glioma-bearing mice. WT and Cd38−/− male mice were i.c. injected with 5 × 10³ GL261 cells, and mice brains were scanned by MRI at 17 and 21 days, as described in Materials and Methods. Images of representative WT (upper panel) and Cd38−/− (lower panel) mice taken at 21 days post-injection are shown in (A) and are displayed from frontal (left) to rostral (right). Tumor volume (B) was calculated, and a repeated-measures ANOVA revealed a significant effect for the genotype (P = .001). Tumor volume was significantly smaller in Cd38−/− mice at day 21 following injection compared with WT mice (*P = .00001, Fisher's least significant difference post-hoc test). Values are presented as the mean ± SEM (bars) (n = 18 WT and 16 Cd38−/− mice, respectively). The survival duration of the mice (C) was monitored. A Kaplan–Meier survival analysis of WT and Cd38−/− by a log-rank test revealed a significant difference between the survival durations of the 2 groups (P = .0003) (n = 18 WT and 16 Cd38−/− mice, respectively). For the aggressive glioma condition, mice were i.c. injected with 1 × 10⁵ GL261 cells, and MRI was conducted at 10, 14, and 17 days post-injection. Images of representative WT (upper panel) and Cd38−/− (lower panel) mice taken at 17 days post-injection are shown in (D) and are displayed from frontal (left) to rostral (right). Tumor volume (E) was calculated at 10, 14, and 17 days post-injection. A repeated-measures ANOVA revealed a significant effect for the genotype (P = .01). Tumor volume was significantly smaller in Cd38−/− mice at day 17 following injection compared with WT mice (*P = .00002, Fisher's least significant difference post-hoc test). Results shown are from a single experiment, and values are presented as the mean ± SEM (bars) (n = 4 WT and 8 Cd38−/− mice, respectively). (F) Comparison of the tumor volume at day 17 in WT and Cd38−/− mice. Values in each experiment were normalized to the average tumor volume in WT mice. The results are expressed as the mean ± SEM (bars) of the normalized tumor volumes of all the mice examined in 5 independent experiments (n = 33 WT and 30 Cd38−/− mice, respectively). The tumor volume was significantly smaller in Cd38−/− mice (P = .002, Student's t test). The survival duration of the mice (G) was monitored as described in Materials and Methods. A Kaplan–Meier survival analysis of WT and Cd38−/− by a log-rank test revealed a significant difference between the survival durations of the 2 groups (P = .03) (n = 20 and 17 for WT and Cd38−/− mice, respectively).
Fig. 2.
Fig. 2.
Similar accumulation of astrocytes in the tumor boundaries in WT and Cd38−/− brains. WT and Cd38−/− mice were injected with 1 × 10⁵ GL261 cells, and 20 days later sections were prepared and stained with anti-GFAP Abs. (A) Representative images of GFAP-stained tumor-containing brain sections of WT and Cd38−/− mice captured at 2× (upper panel) and 40× magnifications (lower panel). Rectangles indicate areas taken for 40× magnification. Scale bar = 500 μm or 50 μm for upper and lower panels, respectively. Quantitation of the density of the GFAP-positive cells in the tumor border (B) did not reveal a significant difference between the genotypes (Student's t test, P = .29). The results presented are from a representative experiment (of 2 independent sets of experiments). The values are presented as the mean ± SEM (bars) (n = 7).
Fig. 3.
Fig. 3.
Assessment of the T cells in WT and Cd38−/− mice. WT and Cd38−/− mice were injected with 1 × 10⁵ GL261 cells; after 20 days, the brains were removed, processed, stained, and analyzed by flow cytometry. (A) The percentage of T cells (CD3+) in the tumor-containing hemisphere was examined within the immune population (CD45 gated cells). Statistical analysis did not reveal a significant difference between the proportion of CD3+ cells within the CD45+ cell population in WT and Cd38−/− (P = .27, Student's t test). The data presented are expressed as the mean ± SEM; bars (n = 8 and 5 for glioma-injected WT and Cd38−/− mice, respectively). (B) The proportion of T-helper (CD4+ cells) or cytotoxic T cells (CD8+ cells) within the T cell population (CD3 gated cells) in the tumor-containing hemisphere. No significant difference was observed in the CD4+ of the CD3+ population between the genotypes (P = .25, Student's t test). The proportion of CD8+ cells of the CD3+ population was significantly higher in WT mice (P = .04, Student's t test). The data presented are expressed as the mean ± SEM; bars (n = 8 and 5 for glioma-injected WT and Cd38−/− mice, respectively).
Fig. 4.
Fig. 4.
MM in the tumor area in WT and Cd38−/− brains. Brain sections, prepared from WT and Cd38−/− mice i.c. injected with 1 × 10⁵ GL261 cells 20 days earlier were immunostained with the anti-Iba1 (with or without counterstaining with hematoxylin) (A) or with anti-F4/80 Ab (B). The images in the lower panel of (B) are magnifications of the areas included in the rectangles in the upper panel. Scale bar = 500 μm. Quantitation of the density of the Iba1- or F4/80-positive cells in the tumor area is shown in (C) and (E), respectively. Statistical analysis revealed significant difference in the F4/80-stained area between the WT and Cd38−/− (Student's t test, *P = .01) but not in the Iba1-stained area (Student's t test, P = .36). The data presented are expressed as the mean ± SEM; bars (n = 9 WT and 8 Cd38−/− mice, respectively). (D) Assessment of the MM cells in WT and Cd38−/− mice. WT and Cd38−/− glioma–bearing mice were processed for flow cytometry, as described in Fig. 3. The percentage of MM (CD11b+) in the tumor-containing hemisphere was examined within the immune population (CD45 gated cells). No significant difference in the proportion of CD11b+ cells within the CD45+ cell population was observed between WT and Cd38−/− (P = .38, Student's t test). The data presented are expressed as the mean ± SEM; bars (n = 8 and 5 for glioma-injected WT and Cd38−/− mice, respectively). (F) Assessment of CD38 expression in MM and TMM. WT mice were injected with GL261 cells or DMEM (sham) and 20 days later brains were removed, processed, stained, and analyzed for CD38 expression by flow cytometry. Expression of CD38 in MM (CD11b gated cells isolated from sham-injected brains) and TMM (CD11b gated cells isolated from GL261-injected brains) was assessed as the mean fluorescence multiplied by the percent of cells expressing the protein. CD38 expression was higher in TMM than in MM (*P = .05, Student's t test). The data presented are expressed as the mean ± SEM; bars n = 4 control samples (each pooled from 2 mice) and 8 glioma-injected mice.
Fig. 5.
Fig. 5.
The effect of CD38 deficiency on tumor features. WT and Cd38−/− mice were i.c. injected with 1 × 10⁵ GL261 cells. Brain sections were counterstained with H&E (A), immunohistochemically stained with anti-BrdU (C), anti-CD31 (G) Abs or TUNEL reagent (E) as described in Materials and Methods. Proliferation was assessed using (A) mitotic cell counting in H&E stained sections (scale bar = 25 μm); (representative mitotic cells are indicated by arrows) and (C) by BrdU staining (scale bar = 500 μm). Quantitation of the number of mitotic cells (B) or BrdU staining of the tumor area (D) did not reveal a significant difference between the genotypes (Student's t test, P = .31 and P = .27, respectively). The data presented are expressed as the mean ± SEM (bars), (n = 4 for H&E and n = 9 WT and 8 Cd38−/− mice for BrdU staining). Cell death was assessed by the TUNEL assay (E), (scale bar = 100 μm). Quantitation of the density of the TUNEL positive cells in the tumor area (F) revealed that the percentage of the tumor area stained by TUNEL was significantly higher in Cd38−/− mice (*P = .05, Student's t test). Results shown are from a representative experiment of 2 independent sets of experiments that yielded similar results. The values are presented as the mean ± SEM (bars) (n = 4). The dotted line represents the tumor border. Vascularization was assessed by the anti-CD31 Ab (G), scale bar = 250 μm. Quantitation of the density of the CD31 positive cells in the tumor area (H) did not reveal a significant difference between the genotypes (Student's t test, P = .48). The data presented are expressed as the mean ± SEM (bars), (n = 7 WT and 6 Cd38−/− mice).
Fig. 6.
Fig. 6.
Reduced MMP-12 levels in tumors of Cd38−/− mice. WT and Cd38−/− mice were i.c. injected with 1 × 10⁵ GL261 cells. (A) Brain sections were stained with anti-MMP-12 Abs as described in Materials and Methods. The images in the lower panel are magnifications of the areas included in the rectangles in the upper panel (scale bar = 500 and 250 μm, respectively). (B) Quantitation of the density of MMP-12 staining revealed a significant difference between WT and Cd38−/− mice (*P = .05, Student's t test) (n = 6 WT and 5 Cd38−/− mice). (C) WT and Cd38−/− mice were i.c. injected with 5 × 10³ GL261 cells. At day 29, brains were removed, proteins were extracted from the tumor-bearing hemisphere, and MMP-12 levels were examined by immunoblotting as described in the Materials and Methods. (D) MMP-12 levels are expressed as signal-intensity values (normalized to β-Tubulin). Expression levels were significantly lower in Cd38−/− mice compared with WT (*P = .039, Student's t test) (n = 9 WT and 4 Cd38−/− mice).
Fig. 7.
Fig. 7.
The effect of CD38 deficiency on MMP-12 and MMP-13 expression in TMM. (A) CD38 deficiency attenuates the glioma-induced expression of MMP-12 and MMP-13 mRNA levels. WT and Cd38−/− mice were i.c. injected with DMEM (sham) or 1 × 10⁵ GL261 cells, and 18, 20, or 22 days later brains were removed for isolation of MM (from sham-injected brains) or TMM (from glioma-injected brains). RNA extraction from the isolated cells was performed as described in Materials and Methods. Data collected from the different TMM samples were classified into 2 groups, one corresponding to TMM isolated from middle phase/size tumor (Middle) and the second large phase/size tumor (Large) as described in Materials and Methods. Comparison of MMP-12 and MMP-13 mRNA levels by the 2−ΔΔCT method revealed a significant effect for the genotype (2-way ANOVA, P = .01 and P = .014, respectively). The values are presented as the mean fold induction ± SEM (bars) relative to WT sham: n = 3 (each TMM sample is a pool from 3 brains, whereas the MM samples each pool 4–5 brains). (B) Examination of MMP-12 protein expression. WT and Cd38−/− mice were i.c. injected as described above. TMM were isolated on day 20, proteins were extracted, and MMP-12 expression was examined by immunoblotting as described in Materials and Methods. MMP-12 expression levels (45 kDa active form) are expressed as signal-intensity values (normalized to GAPDH). Statistical analysis revealed a trend toward reduced MMP-12 levels in Cd38−/− TMM (Student's t test, P = .06). The values are presented as the mean ± SEM (bars): n = 3 (each TMM sample is a pool from 2–4 brains).

Similar articles

Cited by

References

    1. Badie B, Schartner J. Role of microglia in glioma biology. Microsc Res Tech. 2001;54:106–113. doi:10.1002/jemt.1125. - DOI - PubMed
    1. Rivest S. Regulation of innate immune responses in the brain. Nat Rev Immunol. 2009;9:429–439. doi:10.1038/nri2565. - DOI - PubMed
    1. Watters JJ, Schartner JM, Badie B. Microglia function in brain tumors. J Neurosci Res. 2005;81:447–455. doi:10.1002/jnr.20485. - DOI - PubMed
    1. Yang I, Han SJ, Kaur G, Crane C, Parsa AT. The role of microglia in central nervous system immunity and glioma immunology. J Clin Neurosci. 2010;17:6–10. doi:10.1016/j.jocn.2009.05.006. - DOI - PMC - PubMed
    1. Markovic DS, Glass R, Synowitz M, Rooijen N, Kettenmann H. Microglia stimulate the invasiveness of glioma cells by increasing the activity of metalloprotease-2. J Neuropathol Exp Neurol. 2005;64:754–762. doi:10.1097/01.jnen.0000178445.33972.a9. - DOI - PubMed

Publication types

MeSH terms