. 2012 Aug;153(8):3995-4007.
doi: 10.1210/en.2011-1973. Epub 2012 Jun 14.

Placental glucose and amino acid transport in calorie-restricted wild-type and Glut3 null heterozygous mice

Affiliations

Placental glucose and amino acid transport in calorie-restricted wild-type and Glut3 null heterozygous mice

Amit Ganguly et al. Endocrinology. 2012 Aug.

Abstract

Calorie restriction (CR) decreased placenta and fetal weights in wild-type (wt) and glucose transporter (Glut) 3 heterozygous null (glut3(+/-)) mice. Because placental nutrient transport is a primary energy determinant of placentofetal growth, we examined key transport systems. Maternal CR reduced intra- and transplacental glucose and leucine transport but enhanced system A amino acid transport in wt mice. These transport perturbations were accompanied by reduced placental Glut3 and leucine amino acid transporter (LAT) family member 2, no change in Glut1 and LAT family member 1, but increased sodium coupled neutral amino acid transporter (SNAT) and SNAT2 expression. We also noted decreased total and active phosphorylated forms of mammalian target of rapamycin, which is the intracellular nutrient sensor, the downstream total P70S6 kinase, and pS6 ribosomal protein with no change in total and phosphorylated 4E-binding protein 1. To determine the role of placental Glut3 in mediating CR-induced placental transport changes, we next investigated the effect of gestational CR in glut3(+/-) mice. In glut3(+/-) mice, a key role of placental Glut3 in mediating transplacental and intraplacental glucose transport was established. In addition, reduced Glut3 results in a compensatory increase of leucine and system A transplacental transport. On the other hand, diminished Glut3-mediated intraplacental glucose transport reduced leucine transport and mammalian target of rapamycin and preserved LAT and enhancing SNAT. CR in glut3(+/-) mice further reduced transplacental glucose transport and enhanced system A amino acid transport, although the increased leucine transport was lost. In addition, increased Glut3 was seen and preserved Glut1, LAT, and SNAT. These placental changes collectively protect survival of wt and glut3(+/-) fetuses against maternal CR-imposed reduction of macromolecular nutrients.


Figures

Fig. 1.
Fig. 1.
Transplacental and intraplacental macronutrient transfer. A, Glucose uptake consisting of intracellular glucose transport and phosphorylation (glucose-6-phosphate) in ad libitum C and 50% CR wt and glut3 (+/−) d 18.5 gestation placentas is depicted as transplacental and intraplacental glucose uptake. Transplacental glucose uptake (n = 6, 8, 8, 6) is as follows: F value = 9.749, p(ANOVA) = 0.0002, Fisher's PLSD significance is shown as follows: *, vs. wt-C; #, vs. glut3 (+/−)-C; †, vs. wt-CR. *, wt-CR (P = 0.0037), glut3 (+/−)-C (P = 0.0037), glut3 (+/−)-CR (P < 0.0001) vs. wt-C; #, glut3 (+/−)-CR (P = 0.018) vs. glut3 (+/−)-C; †, glut3 (+/−)-CR (P = 0.018) vs. wt-CR. Transplacental glucose-6-phosphate (n = 6, 8, 8, 11) is as follows: F value = 26.158, p(ANOVA) < 0.0001. Fisher's PLSD is as follows: *, wt-CR (P < 0.0001), glut3 (+/−)-C (P = 0.0028), glut3 (+/−)-CR (P < 0.0001) vs. wt-C; #, wt-CR (P = 0.0005), glut3 (+/−)-CR (P < 0.0001) vs. glut3 (+/−)-C. Intraplacental glucose uptake (n = 6, 8, 6, 10) is as follows: F value = 36.898, p(ANOVA) < 0.0001. Fisher's PLSD is as follows: *, wt-CR (<0.0001), glut3 (+/−)-C (<0.0001), glut3 (+/−)-CR (<0.0001) vs. wt-C; #, wt-CR (0.01), glut3 (+/−)-CR (<0.0001) vs. glut3 (+/−)-C; †, glut3 (+/−)-CR (0.05) vs. wt-CR. Intraplacental glucose-6-phosphate (n = 6, 6, 6, 9) is as follows: F value = 14.495, p(ANOVA) < 0.0001. Fisher's PLSD is as follows: *, wt-CR (0.031), glut3 (+/−)-C (0.031), glut3 (+/−)-CR (<0.0001) vs. wt-C; #, glut3 (+/−)-CR (0.0008) vs. glut3 (+/−)-C; †, glut3 (+/−)-CR (0.0008) vs. wt-CR. B, System L (leucine) transfer in ad libitum chow fed (C) and 50% CR wt and glut3 (+/−) d 18.5 gestation placentas is depicted as transplacental and intraplacental leucine transfer. Transplacental leucine transfer (n = 7, 6, 4, 8) is as follows: F value = 4.682, p(ANOVA) = 0.012. Fisher's PLSD is as follows: *, wt-CR (0.045), glut3 (+/−)-C (0.07; Student's t test 0.009) vs. wt-C; #, wt-CR (0.0014) vs. glut3 (+/−)-C; †, glut3 (+/−)-CR (0.03) vs. wt-CR. Intraplacental leucine transfer (n = 7, 6, 4, 8) is as follows: F value = 13.859, p(ANOVA) < 0.0001. Fisher's PLSD is as follows: *, wt-CR (<0.0001), glut3 (+/−)-C (0.0001), glut3 (+/−)-CR (<0.0001) vs. wt-C. C, System A (methylaminoisobutyric acid) transfer in ad libitum chow fed (C) and 50% CR wt and glut3 (+/−) d 18.5 gestation placentas is depicted as transplacental and intraplacental MeAIB acid transfer. Transplacental MeAIB transfer (n = 5, 7, 6, 5) is as follows: F value = 6.330, p(ANOVA) = 0.0037. Fisher's PLSD is as follows: *, glut3 (+/−)-C (0.07, Student's t test 0.05), glut3 (+/−)-CR (0.0007) vs. wt-C; #, glut3 (+/−)-CR (0.0076) vs. glut3 (+/−)-C; †, glut3 (+/−)-CR (0.0027) vs. wt-CR. Intraplacental MeAIB transfer (n = 5, 7, 6, 4) is as follows: F value = 3.185, p(ANOVA) = 0.049. Fisher's PLSD is as follows: *, wt-CR (0.013) vs. wt-C; #, wt-CR (0.027) vs. glut3 (+/−)-C.
Fig. 2.
Fig. 2.
Glucose transporters. Representative Western blots are seen in the top panels depicting Glut3 and Glut1 protein bands in C and CR wt (+/+) and glut3 (+/−) d 18.5 gestation placentas (A) and Glut1 protein bands in d 18.5 gestation embryo (B), with vinculin serving as the internal loading control. Quantification of Glut3 and Glut1 as a ratio to the vinculin protein are expressed as a percent of the wt ad libitum-fed control values in the corresponding bottom panels. Placental Glut3 protein (n = 5/group) (left lower panel) is as follows: F value = 17.240, p(ANOVA) < 0.0001. Fisher's PLSD is as follows: *, wt-CR (0.02), glut3 (+/−)-C (0.003), glut3 (+/−)-CR (0.0069) vs. wt-C; #, glut3 (+/−)-CR (<0.0001) vs. glut3 (+/−)-C; †, glut3 (+/−)-CR (<0.0001) vs. wt-CR. Placental Glut1 protein (n = 5/group) (middle lower panel) is as follows: F value = 4.098, p(ANOVA) = 0.0246. Fisher's PLSD is as follows: #, wt-CR (0.0178) vs. glut3 (+/−)-C; †, glut3 (+/−)-CR (0.0045) vs. wt-CR. Fetal Glut1 protein (n = 5/group) (C) is as follows: F value = 7.133, p(ANOVA) = 0.0029. Fisher's PLSD is as follows: *, wt-CR (0.03), glut3 (+/−)-CR (<0.0021) vs. wt-C; #, wt-CR (0.0194), glut3 (+/−)-CR (0.0013) vs. glut3 (+/−)-C.
Fig. 3.
Fig. 3.
Amino acid transporters. A, Detection of LAT1 and LAT2 mRNA in C and CR d 18.5 placentas of wt and glut3 (+/−) mice by RT-PCR using specific primers (top panel). Cyclophilin served as the internal control. Relative band intensity was quantified and expressed as a percentage of the wt ad libitum control (bottom panel). A, LAT1 mRNA (n = 5/group): F value = 0.639, p(ANOVA) = 0.6008; Fisher's PLSD was not significant; LAT2 mRNA (n = 6, 5, 5, 5): F value = 2.68, p(ANOVA) = 0.0797; Fisher's PLSD is as follows: #, glut3 (+/−)-CR (0.015) vs. glut3 (+/−)-C. B, LAT2 protein is shown in C and CR wt and glut3 (+/−) d 18.5 gestation placenta (n = 7/group). F value = 0.708, p(ANOVA) = 0.5564. Fisher's PLSD was not significant; *, Student's t test is as follows: *, wt-CR (0.047) vs. wt-C. C, SNAT1 and SNAT2 mRNA in C and CR wt and glut3 (+/−) placentas. SNAT1 mRNA (n = 6, 5, 5, 5): F value = 4.473, p(ANOVA) = 0.0183. Fisher's PLSD is as follows: *, wt-CR (0.0047), glut3 (+/−)-C (0.032) and glut3 (+/−)-CR (0.013) vs. wt-C. SNAT2 mRNA (n = 6, 5, 5, 5): F value = 2.713, p(ANOVA) = 0.0795. Fisher's PLSD is as follows: *, wt-CR (0.0397), glut3 (+/−)-C (0.04), and glut3 (+/−)-CR (0.036) vs. wt-C.
Fig. 4.
Fig. 4.
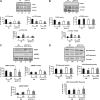
mTOR signaling molecules and AMPK. Representative Western blots shown in top panels demonstrate total and phosphorylated mTOR (A), S6K (Thr-389) (B), 4E-BP1 (C), S6 ribosomal (ser 235/236) (D), and AMPK (E) protein bands, with vinculin as the internal loading control. Quantification is shown in the corresponding bottom panels. A, Total mTOR (n = 5/group): F value = 7.312, p(ANOVA) = 0.0026. Fisher's PLSD is as follows: *, wt-CR (0.0005), glut3 (+/−)-C (0.018), glut3 (+/−)-CR (0.0021) vs. wt-C. pmTOR (n = 5/group): F value = 3.284, p(ANOVA) = 0.0481. Fisher's PLSD is as follows: *, wt-CR (0.035), glut3 (+/−)-CR (0.0086) vs. wt-C. p-mTOR/mTOR (n = 5/group): F value = 0.63, p(ANOVA) = 0.6050. Fisher's PLSD was not significant. B, Total S6K (n = 5/group): F value = 2.179, p(ANOVA) = 0.13. Fisher's PLSD is as follows: *, wt-CR (0.0275) vs. wt-C. p-S6K (n = 6/group): F value = 0.121, p(ANOVA) = 0.9466. Fisher's PLSD was not significant. p-S6K/S6K (n = 5/group): F value = 1.822, p(ANOVA) = 0.1838. Fisher's PLSD is as follows: *, wt-CR (0.0335) vs. wt-C. C, Total 4E-BP (n = 6/group): F value = 2.382, p(ANOVA) = 0.0998. Fisher's PLSD is as follows: †, glut3 (+/−)-C (0.025) vs. wt-CR; #, glut3 (+/−)-CR (0.0447) vs. glut3 (+/−)-C. p4E-BP1 (n = 6/group): F value = 1.199, p(ANOVA) = 0.3355. Fisher's PLSD was not significant. p4E-BP1/4E-BP1 (n = 6/group): F value = 0.893, p(ANOVA) = 0.4616. Fisher's PLSD was not significant. D, Total S6-r (n = 5/group). F value = 1.064, p(ANOVA) = 0.3922. Fisher's PLSD was not significant [wt-CR vs. glut3 (+/−)-C, P = 0.096]. p-S6-r (n = 5/group): F value = 1.829, p (ANOVA) = 0.1825. Fisher's PLSD is as follows: #, wt-CR (0.0393) vs. glut3 (+/−)-C. p-S6-r/S6-r (n = 5/group): F value = 0.118, p(ANOVA) = 0.9481. Fisher's PLSD was not significant. E, Total AMPK (n = 6/group): F value = 0.519, p(ANOVA) = 0.6741. Fisher's PLSD was not significant. pAMPK (n = 6/group): F value = 0.278, p(ANOVA) = 0.8404. Fisher's PLSD was not significant. pAMPK/AMPK (n = 6/group): F value = 0.728, p(ANOVA) = 0.5473. Fisher's PLSD was not significant.
Fig. 4.
Fig. 4.
mTOR signaling molecules and AMPK. Representative Western blots shown in top panels demonstrate total and phosphorylated mTOR (A), S6K (Thr-389) (B), 4E-BP1 (C), S6 ribosomal (ser 235/236) (D), and AMPK (E) protein bands, with vinculin as the internal loading control. Quantification is shown in the corresponding bottom panels. A, Total mTOR (n = 5/group): F value = 7.312, p(ANOVA) = 0.0026. Fisher's PLSD is as follows: *, wt-CR (0.0005), glut3 (+/−)-C (0.018), glut3 (+/−)-CR (0.0021) vs. wt-C. pmTOR (n = 5/group): F value = 3.284, p(ANOVA) = 0.0481. Fisher's PLSD is as follows: *, wt-CR (0.035), glut3 (+/−)-CR (0.0086) vs. wt-C. p-mTOR/mTOR (n = 5/group): F value = 0.63, p(ANOVA) = 0.6050. Fisher's PLSD was not significant. B, Total S6K (n = 5/group): F value = 2.179, p(ANOVA) = 0.13. Fisher's PLSD is as follows: *, wt-CR (0.0275) vs. wt-C. p-S6K (n = 6/group): F value = 0.121, p(ANOVA) = 0.9466. Fisher's PLSD was not significant. p-S6K/S6K (n = 5/group): F value = 1.822, p(ANOVA) = 0.1838. Fisher's PLSD is as follows: *, wt-CR (0.0335) vs. wt-C. C, Total 4E-BP (n = 6/group): F value = 2.382, p(ANOVA) = 0.0998. Fisher's PLSD is as follows: †, glut3 (+/−)-C (0.025) vs. wt-CR; #, glut3 (+/−)-CR (0.0447) vs. glut3 (+/−)-C. p4E-BP1 (n = 6/group): F value = 1.199, p(ANOVA) = 0.3355. Fisher's PLSD was not significant. p4E-BP1/4E-BP1 (n = 6/group): F value = 0.893, p(ANOVA) = 0.4616. Fisher's PLSD was not significant. D, Total S6-r (n = 5/group). F value = 1.064, p(ANOVA) = 0.3922. Fisher's PLSD was not significant [wt-CR vs. glut3 (+/−)-C, P = 0.096]. p-S6-r (n = 5/group): F value = 1.829, p (ANOVA) = 0.1825. Fisher's PLSD is as follows: #, wt-CR (0.0393) vs. glut3 (+/−)-C. p-S6-r/S6-r (n = 5/group): F value = 0.118, p(ANOVA) = 0.9481. Fisher's PLSD was not significant. E, Total AMPK (n = 6/group): F value = 0.519, p(ANOVA) = 0.6741. Fisher's PLSD was not significant. pAMPK (n = 6/group): F value = 0.278, p(ANOVA) = 0.8404. Fisher's PLSD was not significant. pAMPK/AMPK (n = 6/group): F value = 0.728, p(ANOVA) = 0.5473. Fisher's PLSD was not significant.

Similar articles

Cited by

References

    1. Barker DJ. 1995. The Wellcome Foundation Lecture. The fetal origins of adult disease. Proc Biol Sci 262:37–43 - PubMed
    1. Barker DJ. 2007. The origins of the developmental origins theory. J Intern Med 261:412–417 - PubMed
    1. Fowden AL, Forhead AJ, Coan PM, Burton GJ. 2008. The placenta and intrauterine programming. J Neuroendocrinol 20:439–450 - PubMed
    1. Jansson T, Powell TL. 2006. IEPA 2005 Award in Placentology Lecture. Human placental transport in altered fetal growth: does the placenta function as a nutrient sensor? Placenta 27(Suppl A):S91–S97.5 - PubMed
    1. Sadiq HF, Das UG, Tracy TF, Devaskar SU. 1999. Intra-uterine growth restriction differentially regulates perinatal brain and skeletal muscle glucose transporters. Brain Res 823:96–103 - PubMed

Publication types