. 2012 Aug 3;287(32):27158-67.
doi: 10.1074/jbc.M112.353250. Epub 2012 Jun 14.

Super-resolution imaging reveals the internal architecture of nano-sized syntaxin clusters

Affiliations

Super-resolution imaging reveals the internal architecture of nano-sized syntaxin clusters

Dana Bar-On et al. J Biol Chem. .

Abstract

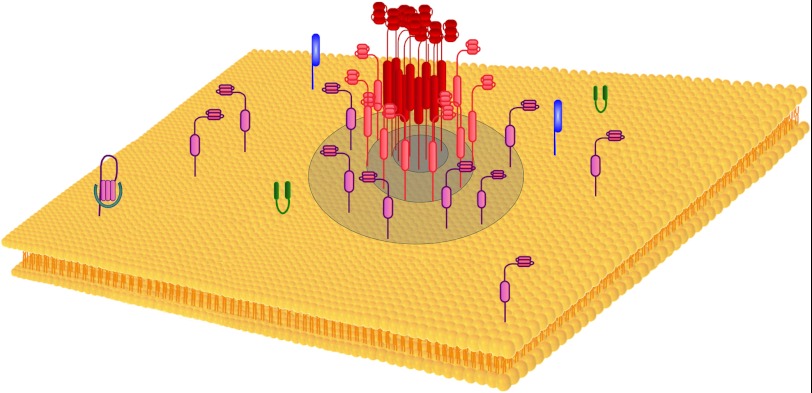
Key synaptic proteins from the soluble SNARE (N-ethylmaleimide-sensitive factor attachment protein receptor) family, among many others, are organized at the plasma membrane of cells as clusters containing dozens to hundreds of protein copies. However, the exact membranal distribution of proteins into clusters or as single molecules, the organization of molecules inside the clusters, and the clustering mechanisms are unclear due to limitations of the imaging and analytical tools. Focusing on syntaxin 1 and SNAP-25, we implemented direct stochastic optical reconstruction microscopy together with quantitative clustering algorithms to demonstrate a novel approach to explore the distribution of clustered and nonclustered molecules at the membrane of PC12 cells with single-molecule precision. Direct stochastic optical reconstruction microscopy images reveal, for the first time, solitary syntaxin/SNAP-25 molecules and small clusters as well as larger clusters. The nonclustered syntaxin or SNAP-25 molecules are mostly concentrated in areas adjacent to their own clusters. In the clusters, the density of the molecules gradually decreases from the dense cluster core to the periphery. We further detected large clusters that contain several density gradients. This suggests that some of the clusters are formed by unification of several clusters that preserve their original organization or reorganize into a single unit. Although syntaxin and SNAP-25 share some common distributional features, their clusters differ markedly from each other. SNAP-25 clusters are significantly larger, more elliptical, and less dense. Finally, this study establishes methodological tools for the analysis of single-molecule-based super-resolution imaging data and paves the way for revealing new levels of membranal protein organization.


Figures

FIGURE 1.
FIGURE 1.
dSTORM imaging of syntaxin membranal clusters versus single molecules. A, representative conventional fluorescence image of syntaxin staining in a native membrane sheet. Due to super-position of all single fluorescent fluorophores, the structure appears blurred in the conventional wide-field image. B, a dSTORM image of the membranal staining of syntaxin with superior resolution was reconstructed from thousands of single-molecule localizations. Insets in A and B are magnified sections of the same region in the membrane imaged by conventional fluorescence and by dSTORM. C, representative membranal region of 500 nm2, which includes all fluorophore localization coordinates (black circles) representing syntaxin molecules gathered during dSTORM imaging of this region. The center of mass (red points) of each putative cluster was located among the total number of localizations using ImageJ as described under “Experimental Procedures.” D, a density-based algorithm recognizes the members of each cluster (red circles) and the single-molecule localizations (blue circles) as detailed under “Experimental Procedures.”
FIGURE 2.
FIGURE 2.
The inner structure of syntaxin clusters and distribution of cluster sizes. A, three-dimensional plot of a representative example of the internal density gradient of localizations in two clusters. Each of the localizations is marked with a color that represents the number of neighboring localizations in a 30-nm radius around it. The localization scale ranges from 0 to 180 (z axis). The center of the cluster exhibits a high density of localizations, and the outer parts of the cluster show a decreasing gradient of localization density. B, histogram of cluster size, represented by the mean diameter of clusters as calculated by PC analysis, reveals an exponential distribution (see “Experimental Procedures”). C, plot of a representative membrane showing the distribution and inner gradients of several syntaxin clusters. Black frame: a super-cluster composed of three smaller clusters. Blue frame: two small adjacent clusters that might be in the process of uniting. Red frame: a large cluster with a single density gradient.
FIGURE 3.
FIGURE 3.
Distribution of the nonclustered localizations as a function of cluster proximity. A, representative image of a membrane presenting localization of the single-molecule pool (black points) that resides close to the clusters (red points). Areas devoid of syntaxin appear in the membranal region. B, histogram presenting the percentage of single-molecule localizations as a function of their distance from the nearest cluster (values are presented in nm). The probability of finding a single molecule of syntaxin decreases exponentially as the distance to the cluster increases.
FIGURE 4.
FIGURE 4.
SNAP-25 membranal distribution. A, using the same clustering procedure, SNAP-25 clusters were identified side by side to nonclustered molecules. Each cluster is marked by the set of localizations that were attributed to it using the density-based algorithms (each cluster is presented by a different color); the nonclustered pool is marked in black circles. Please note that there are membranal areas that are completely devoid of SNAP-25. B, three-dimensional plot of a representative SNAP-25 cluster inner density gradient of localizations decreasing from the dense core to the periphery of the cluster. Each of the localizations is marked with a color that represents the number of neighboring localizations in a 30-nm radius around it. The localization scale ranges from 0 to 500 (z axis). C, histogram presenting the percentage of SNAP-25 single-molecule localizations as a function of their distance from the nearest cluster (values are presented in nm).
FIGURE 5.
FIGURE 5.
Proposed model of the nano-scale membranal organization of syntaxin. Syntaxin distributes nonhomogeneously at the membrane, forming clusters alongside single molecules. The clusters exhibit an internal density gradient of molecules. In the example presented, a gradient of syntaxin molecules is demonstrated decreasing from the cluster center (red) to its peripheries (pink and purple). The single-molecule pool of syntaxin (purple) concentrates at and near the cluster boundaries where the molecules can react with their partners, e.g. SNAP-25 (green), synaptobrevin (blue), and Munc18 (cyan). A similar model can be applied for SNAP-25 clusters.
FIGURE 6.
FIGURE 6.
Two-dimensional membrane-like grid modeling of SNARE protein distribution and kinetics. Monte Carlo-based modeling (see “Experimental Procedures”) of syntaxin (white circles) dynamics and distribution in the plasma membrane during the assembly of cis-SNARE complexes (cyan). Two simulations (100,000 steps), each representing two scenarios of SNARE protein distribution, were performed, and the amount of cis-SNARE complexes formed and their locations in the two simulations were compared. The first scenario of the simulation includes a homogeneous membrane. Syntaxin is homogeneously and randomly distributed in the membrane and can freely diffuse and interact with SNAP-25 (gray squares) to form binary complexes (green circles) and then with synaptobrevin (blue squares) to form cis-SNARE complexes (cyan circles) according to preassigned rate coefficients. A and B, two snapshots taken at different time points from the simulation showing the formation of binary and ternary SNARE complexes (C–E) In the second scenario examined using the simulation, the majority of the syntaxin population is clustered (66%), and the protein can leave the clusters and interact with the other proteins at the clusters or outside according to the same rate coefficients assigned in the first scenario (C). As can be seen, binary complexes and cis-SNARE complexes are formed first mainly between clusters (D) and then at the periphery of clusters as well (E).

Similar articles

Cited by

References

    1. Lingwood D., Simons K. (2010) Lipid rafts as a membrane-organizing principle. Science 327, 46–50 - PubMed
    1. Hanzal-Bayer M. F., Hancock J. F. (2007) Lipid rafts and membrane traffic. FEBS Lett. 581, 2098–2104 - PubMed
    1. Jacobson K., Mouritsen O. G., Anderson R. G. (2007) Lipid rafts: at a crossroad between cell biology and physics. Nat. Cell Biol. 9, 7–14 - PubMed
    1. Lang T. (2007) SNARE proteins and “membrane rafts.” J. Physiol. 585, 693–698 - PMC - PubMed
    1. Shaw A. S. (2006) Lipid rafts: now you see them, now you don't. Nat. Immunol. 7, 1139–1142 - PubMed

Publication types

Substances

LinkOut - more resources