. 2012 Jul 27;287(31):26388-99.
doi: 10.1074/jbc.M112.346775. Epub 2012 Jun 14.

The human selenoprotein VCP-interacting membrane protein (VIMP) is non-globular and harbors a reductase function in an intrinsically disordered region

Affiliations

The human selenoprotein VCP-interacting membrane protein (VIMP) is non-globular and harbors a reductase function in an intrinsically disordered region

Lea Cecilie Christensen et al. J Biol Chem. .

Abstract

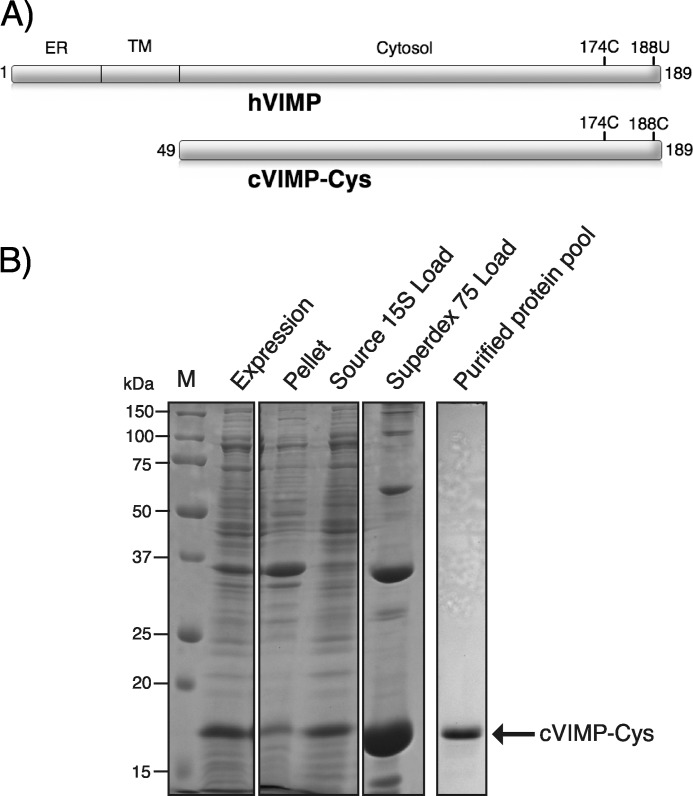
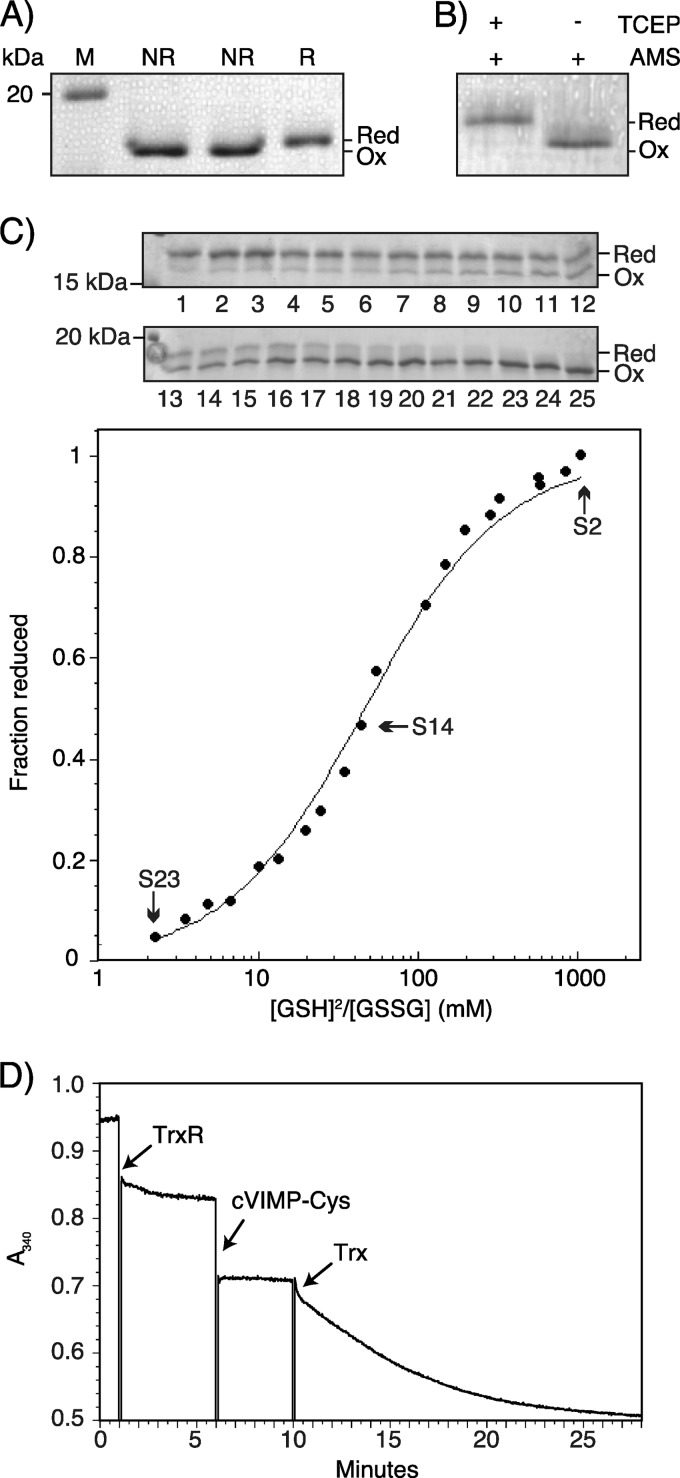
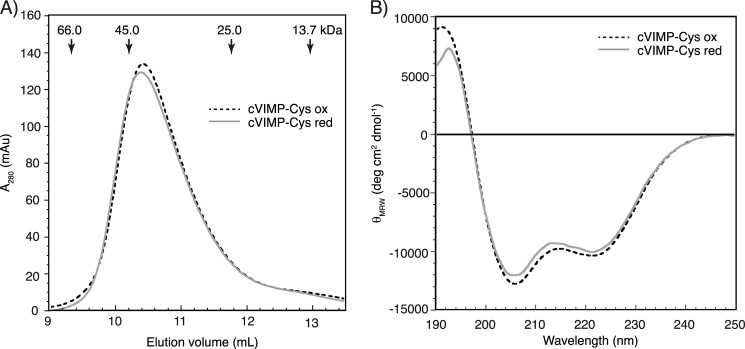
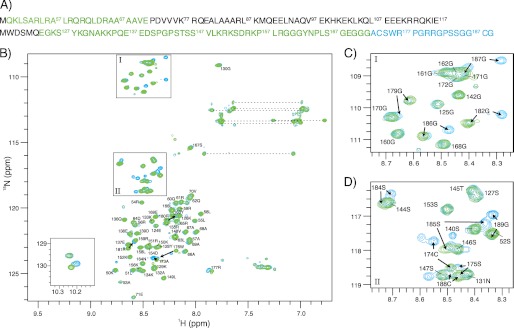
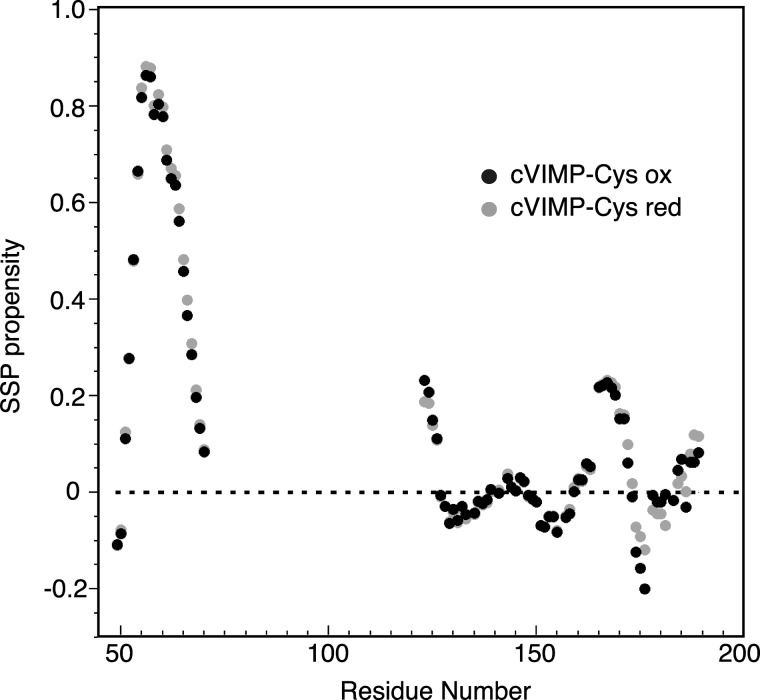
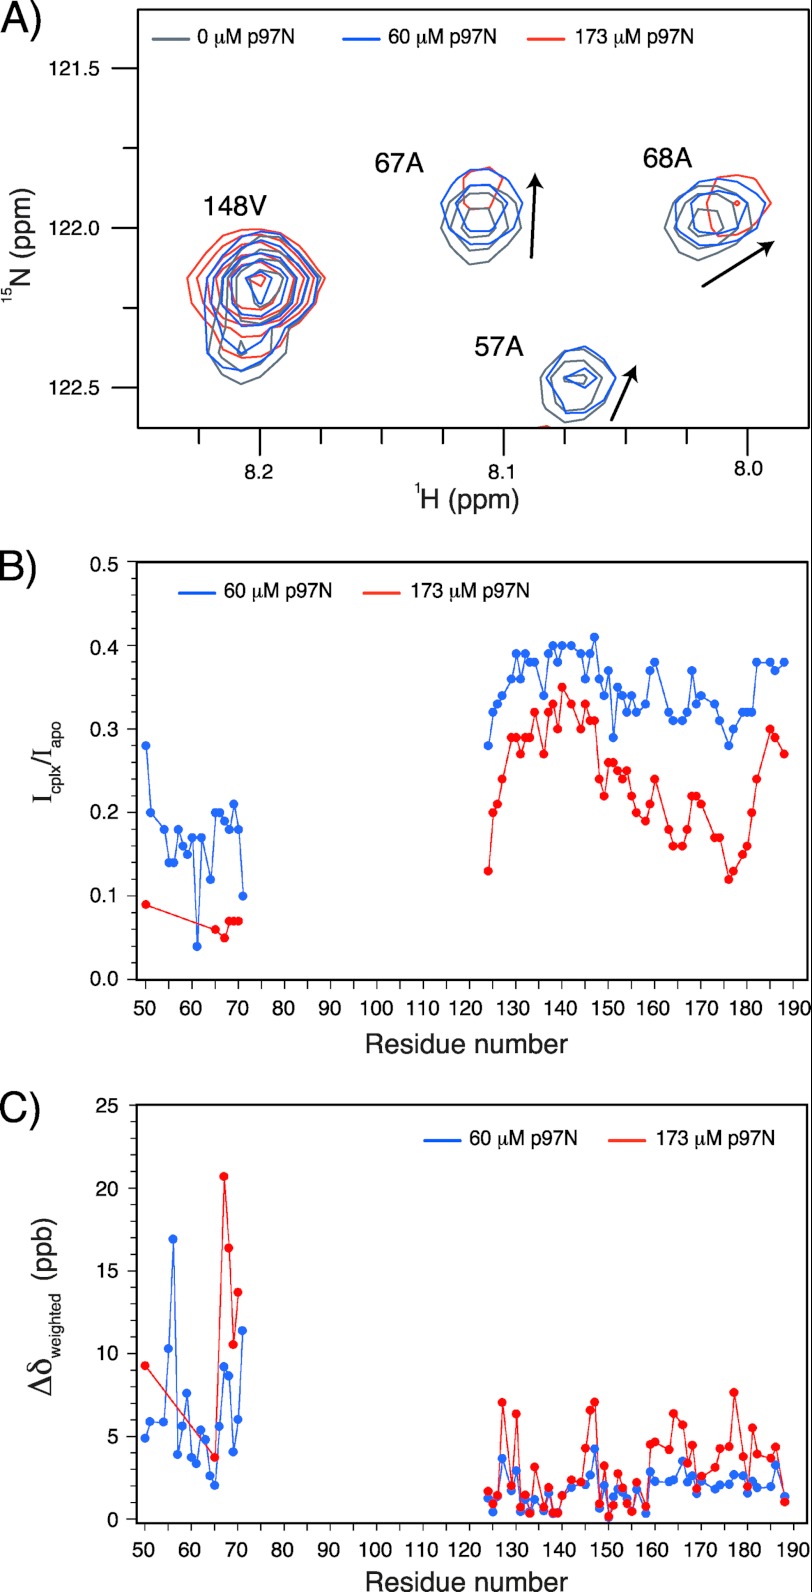
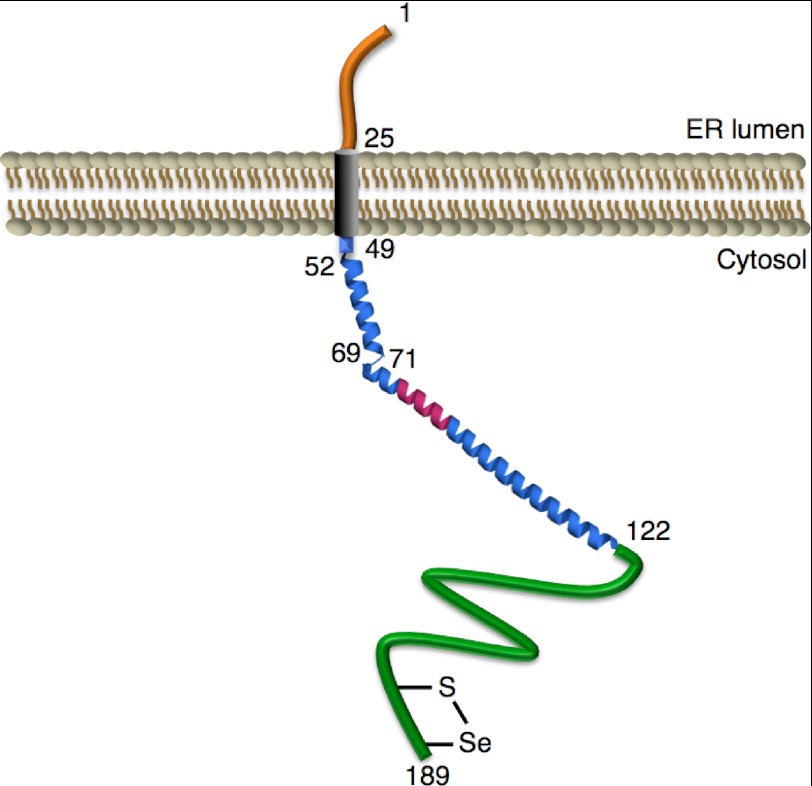
The human selenoprotein VIMP (VCP-interacting membrane protein)/SelS (selenoprotein S) localizes to the endoplasmic reticulum (ER) membrane and is involved in the process of ER-associated degradation (ERAD). To date, little is known about the presumed redox activity of VIMP, its structure and how these features might relate to the function of the protein in ERAD. Here, we use the recombinantly expressed cytosolic region of VIMP where the selenocysteine (Sec) in position 188 is replaced with a cysteine (a construct named cVIMP-Cys) to characterize redox and structural properties of the protein. We show that Cys-188 in cVIMP-Cys forms a disulfide bond with Cys-174, consistent with the presence of a Cys174-Sec188 selenosulfide bond in the native sequence. For the disulfide bond in cVIMP-Cys we determined the reduction potential to -200 mV, and showed it to be a good substrate of thioredoxin. Based on a biochemical and structural characterization of cVIMP-Cys using analytical gel filtration, CD and NMR spectroscopy in conjunction with bioinformatics, we propose a comprehensive overall structural model for the cytosolic region of VIMP. The data clearly indicate the N-terminal half to be comprised of two extended α-helices followed by a C-terminal region that is intrinsically disordered. Redox-dependent conformational changes in cVIMP-Cys were observed only in the vicinity of the two Cys residues. Overall, the redox properties observed for cVIMP-Cys are compatible with a function as a reductase, and we speculate that the plasticity of the intrinsically disordered C-terminal region allows the protein to access many different and structurally diverse substrates.


Figures

FIGURE 1.
FIGURE 1.
Overview of VIMP and purification of the cVIMP-Cys construct. A, schematic representation of human VIMP (hVIMP) and the cytosolic construct (cVIMP-Cys) used in this study. ER, endoplasmic reticulum region; TM, transmembrane region; Cytosol, cytosolic region. The position of Cys-174 (174C) and Sec188 (188U)/Cys188 (188C) is marked. B, purification of recombinantly expressed cVIMP-Cys. 18% reducing Coomassie-stained SDS-PAGE gel of Expression (total cell lysate), Pellet (after centrifugation of total lysate), Source 15S Load (supernatant from centrifugation of total lysate), Superdex 75 Load (pooled and concentrated fractions from Source 15S) and Purified protein pool (pooled fractions from Superdex 75). The arrow indicates the position of cVIMP-Cys and M denotes molecular weight marker.
FIGURE 2.
FIGURE 2.
Redox characterization of cVIMP-Cys. A, 15% Coomassie-stained SDS-PAGE gel of cVIMP-Cys under non-reducing (NR; the exact same sample loaded twice) and reducing (R; 10 mm DTT) conditions, as indicated above each lane. M denotes molecular weight marker. Note that the mobility shift observed for the reduced protein was also seen for a small fraction of the molecules in the non-reducing samples bordering the reducing samples as a result of the diffusion of the reducing agent into the neighboring lane. B, purified cVIMP-Cys was incubated either with or without 10 mm TCEP and subsequently modified with AMS. The position of oxidized (Ox) and reduced (Red) cVIMP-Cys is marked on each gel. C, equilibrium constant for the reaction between cVIMP-Cys and glutathione. 18% non-reducing Coomassie-stained SDS-PAGE gels of AMS-modified cVIMP-Cys incubated at different ratios of [GSH]2/[GSSG] (samples 2–23). The position of reduced (Red) and oxidized (Ox) cVIMP-Cys is marked. The intensity of each band was quantified using the ImageJ software and plotted as fraction reduced cVIMP-Cys versus [GSH]2/[GSSG], which was determined by HPLC analysis. Sample 1 (reduced with 0.5 mm TCEP), sample 24 (oxidized with 2 mm GSSG), and sample 25 (untreated) were not included in the plot. Neither was sample 6 (an outlier) nor sample 12 (not possible to quantify from the gel). Data points for samples 2, 14 and 23 are indicated. The following equation: Fraction of reduced cVIMP-Cys = [GSH]2/[GSSG]/(Keq + [GSH]2/[GSSG]) was used to fit to the data points, which yielded a Keq = 47 mm. D, cVIMP-Cys is reduced by the thioredoxin system in vitro. The absorbance of 155 μm NADPH was followed at 340 nm over time upon the addition of components of the thioredoxin system and purified cVIMP-Cys. The arrows indicate the time points where TrxR (0.1 μm), cVIMP-Cys (25 μm), and Trx (0.5 μm) were added.
FIGURE 3.
FIGURE 3.
Basic structural characterization of oxidized and reduced cVIMP-Cys. A, elution profiles of oxidized (dashed line) and reduced (solid line) cVIMP-Cys obtained from analytical gel filtration on a Superdex 75 column. The apparent mass of cVIMP-Cys was calculated (yielding 41.3 kDa and 42.0 kDa for oxidized and reduced cVIMP-Cys, respectively) from the elution volumes of standard proteins (indicated by arrows). mAU, milli absorbance units. B, Far-UV CD spectra of oxidized (dashed line) and reduced (solid line) cVIMP-Cys recorded at 5 °C. The complete reduction and oxidation of cVIMP-Cys in all experiments in this figure was verified by the AMS shift assay (data not shown).
FIGURE 4.
FIGURE 4.
HSQC spectra of oxidized and reduced cVIMP-Cys with assigned peaks. A, amino acid sequence of cVIMP-Cys. Black letters indicate residues that could not be assigned. For the assigned residues, blue and green letters indicate those that do and do not shift between the two redox states, respectively. B, HSQC spectrum of oxidized (blue) overlaid with the spectrum of reduced (green) cVIMP-Cys. The spectra were recorded on an 800 MHz spectrometer at 5 °C and pH 7.0. Assigned residues are marked with residue number and one letter code. Arrows indicate where the peaks shift. The isotope-dimension is marked on the axes. Boxes indicate zoom area I and II shown in C and D. Dashed lines indicate the pairwise arrangement of NH2-containing side chains from Asn and Gln. Inset: signals from the two Trp side chains. C and D, zoom of areas I and II. The assigned peaks are indicated with residue number and one letter code. Arrows indicate where the peak shifts to between the two redox states. Note that the spectrum of the oxidized sample contains peaks corresponding to both oxidized and reduced cVIMP-Cys, illustrating that the sample contained a mixture of the two redox forms (see for instance Gly-182 or Gly-186, panel C). The reason for this observation is currently unknown, but does not change the conclusions drawn based on these experiments.
FIGURE 5.
FIGURE 5.
Prediction of secondary structure using chemical shifts. A, SSP analysis of α-helix (SSP score > 0) and β-strand (SSP score < 0) from Cα, C′, H, and N chemical shifts of oxidized (black dots) and reduced (gray dots) cVIMP-Cys plotted as a function of residue number. The dashed line at zero indicates disordered structure.
FIGURE 6.
FIGURE 6.
cVIMP-Cys interacts with the N-domain of p97. A, HSQC spectra were recorded of 15N-cVIMP-Cys (50 μm) in the absence of p97N, and in the presence of 60 μm and 173 μm p97N. Four selected peaks from the HSQC spectra are shown as an overlay of 50 μm 15N-cVIMP-Cys (gray), 50 μm 15N-cVIMP-Cys with 60 μm p97N (blue, 4-fold decrease in the base contour level), and 50 μm 15N-cVIMP-Cys with 173 μm p97N (red, 8-fold decrease in the base contour level). The plotting at different contour levels of the spectra is necessary to see peaks in all three spectra. Arrows indicate the direction of the chemical shift change. B, plot of intensity ratio (Icplx/Iapo) as a function of residue number. Icplx denotes the intensity of peaks in the sample with either 60 μm p97N (blue) or 173 μm (red) p97N, and Iapo refers to the intensity of peaks in the sample without p97N. C, change in peak positions reported as the weighted chemical shift difference induced by addition of p97N (Δδweighted) is plotted as a function of residue number for peaks in the samples with 60 μm p97N (blue) and 173 μm p97N (red). Δδweighted is given in parts per billion (ppb). Peaks that were poorly defined or completely absent are not included in the plots in panels B and C (thus the lack of data points for e.g. most of residues 50–71 in the sample with 173 μm p97N). Signals for residues 72–123 were not observed even in the absence of p97N (see text for details).
FIGURE 7.
FIGURE 7.
An overall structural model for VIMP. The ER (orange) and transmembrane regions (gray) are based on predictions using TMHMM (21, 22). The overall structure of the cytosolic region is based on findings in this study, as well as the crystal structure of a VIMP fragment comprising residues 52–122 (PDB ID: 2Q2F; unpublished). This cytosolic region consists of an α-helical region (blue) harboring the putative VIM (residues 78–88; pink), and an intrinsically disordered region (residues 123–189; green). The expected selenosulfide bond formed by Cys-174 and Sec188 is indicated. Numbers denote residue positions.

References

    1. Smith M. H., Ploegh H. L., Weissman J. S. (2011) Road to ruin: targeting proteins for degradation in the endoplasmic reticulum. Science 334, 1086–1090 - PMC - PubMed
    1. Claessen J. H., Kundrat L., Ploegh H. L. (2012) Protein quality control in the ER: balancing the ubiquitin checkbook. Trends Cell Biol. 22, 22–32 - PMC - PubMed
    1. Carvalho P., Goder V., Rapoport T. A. (2006) Distinct ubiquitin-ligase complexes define convergent pathways for the degradation of ER proteins. Cell 126, 361–373 - PubMed
    1. Denic V., Quan E. M., Weissman J. S. (2006) A luminal surveillance complex that selects misfolded glycoproteins for ER-associated degradation. Cell 126, 349–359 - PubMed
    1. Christianson J. C., Shaler T. A., Tyler R. E., Kopito R. R. (2008) OS-9 and GRP94 deliver mutant α1-antitrypsin to the Hrd1-SEL1L ubiquitin ligase complex for ERAD. Nat. Cell Biol. 10, 272–282 - PMC - PubMed

Publication types

MeSH terms

LinkOut - more resources