. 2012 Aug 3;287(32):27244-54.
doi: 10.1074/jbc.M111.274829. Epub 2012 Jun 14.

Palmitoleate is a mitogen, formed upon stimulation with growth factors, and converted to palmitoleoyl-phosphatidylinositol

Affiliations

Palmitoleate is a mitogen, formed upon stimulation with growth factors, and converted to palmitoleoyl-phosphatidylinositol

Andreas Koeberle et al. J Biol Chem. .

Abstract

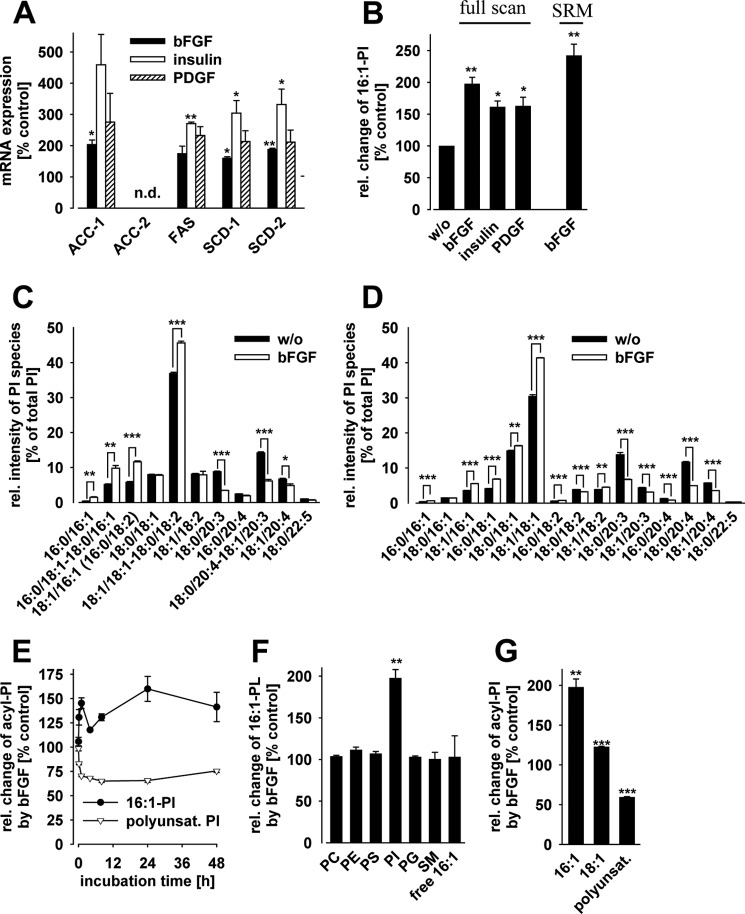
Controversial correlations between biological activity and concentration of the novel lipokine palmitoleate (9Z-hexadecenoate, 16:1) might depend on the formation of an active 16:1 metabolite. For its identification, we analyzed the glycerophospholipid composition of mouse Swiss 3T3 fibroblasts in response to 16:1 using LC-MS/MS. 16:1 was either supplemented to the cell culture medium or endogenously formed when cells were stimulated with insulin or growth factors as suggested by the enhanced mRNA expression of 16:1-biosynthetic enzymes. The proportion of 1-acyl-2-16:1-sn-phosphatidylinositol (16:1-PI) was time-dependently and specifically increased relative to other glycerophospholipids under both conditions and correlated with the proliferation of fatty acid (16:1, palmitate, oleate, or arachidonate)-supplemented cells. Accordingly, cell proliferation was impaired by blocking 16:1 biosynthesis using the selective stearoyl-CoA desaturase-1 inhibitor CAY10566 and restored by supplementation of 16:1. The accumulation of 16:1-PI occurred throughout cellular compartments and within diverse mouse cell lines (Swiss 3T3, NIH-3T3, and 3T3-L1 cells). To elucidate further whether 16:1-PI is formed through the de novo or remodeling pathway of PI biosynthesis, phosphatidate levels and lyso-PI-acyltransferase activities were analyzed as respective markers. The proportion of 16:1-phosphatidate was significantly increased by insulin and growth factors, whereas lyso-PI-acyltransferases showed negligible activity for 16:1-coenzyme A. The relevance of the de novo pathway for 16:1-PI biosynthesis is supported further by the comparable incorporation rate of deuterium-labeled 16:1 and tritium-labeled inositol into PI for growth factor-stimulated cells. In conclusion, we identified 16:1 or 16:1-PI as mitogen whose biosynthesis is induced by growth factors.


Figures

FIGURE 1.
FIGURE 1.
16:1 induces proliferation of Swiss 3T3 cells and specifically increases cellular 16:1-PI levels. A, serum-starved Swiss 3T3 cells were supplemented with 10% FCS, fatty acids (16:0, 16:1, 18:1, or 20:4; 5 μm) or vehicle (methanol, w/o) and treated with or without PDGF (25 ng/ml) for 24 h. Cell proliferation was assessed using a WST-8 colorimetric reduction assay. B and C, Swiss 3T3 cells in DMEM plus 10% charcoal-stripped serum were treated with vehicle (DMSO), 16:1 (50 μm), and/or CAY10566 (at the indicated concentrations) for 24 h prior to cell counting. D, cells were supplemented with d14-16:1 (5 μm), and the percentage change of the proportion of d14-labeled species in PL subclasses was time-dependently assessed. E, time-dependent percentage change of the relative intensity of 16:1-containing PI for cells incubated in the presence of d14-16:1 (5 μm) is shown. 100% values correspond to a relative intensity in absence of d14-16:1 of 6.5 ± 0.3%. F, change of the relative intensity of 16:1-containing PL species for cells treated with 16:1 (5 μm) alone or in combination with bFGF (10 ng/ml), insulin (1 μm), or PDGF (25 ng/ml) for 4 h is shown as a percentage of untreated cells. The 100% value for PI was chosen as for E and corresponds for PC, PE, PS, PG, and sphingomyelins (SM) to 48.8 ± 0.3%, 20.0 ± 0.4%, 11.8 ± 0.5%, 59.8 ± 0.9%, and 1.8 ± 0.1%, respectively. G, relative intensity of 16:1-PI (16:0/16:1, 16:0/18:1–18:0/16:1, and 18:1/16:1) or 16:0-containing PI (16:0/16:1, 16:0/18:1–18:0/16:1, 16:0/20:4) of cells treated with or without 16:1 (5 μm) or 16:0 (10 μm) for 24 h, respectively, is shown. Data are given as means ± S.E. (error bars); n = 2–6. *, p < 0.05; **, p < 0.01; ***, p < 0.001 versus the untreated (w/o; A, left panel, C, F, and G) or PDGF-stimulated control (w/o, A, right panel); ANOVA + Tukey HSD post-hoc tests (A, C, and F) and Student's t test (G).
FIGURE 2.
FIGURE 2.
Characterization of PI(16:0/16:1) in Swiss 3T3 cell extracts by LC-MS/MS. A, single ion monitoring of m/z = 807.5 ([M−H]). B, precursor ion scanning of m/z = 241.0 (PI headgroup). The extracted mass trace of m/z = 807.5 ([M−H]) is shown. C, the negative-ion LC-MS spectrum averaged over the time from 16.05 to 16.63 min. D, mass spectrum of the product ion scan (parent mass: m/z = 807.5) averaged over the time window from 16.21 to 16.50 min. The fatty acid anions (FA) are marked.
FIGURE 3.
FIGURE 3.
Insulin and growth factors induce enzymes of 16:1 biosynthesis and promote the accumulation of 16:1-PI in Swiss 3T3 cells. A and B, Swiss 3T3 cells were treated with 10 ng/ml bFGF, 1 μm insulin, or 25 ng/ml PDGF for 24 h. A, mRNA expression of enzymes of 16:1 biosynthesis was determined by RT-PCR and is given as a percentage of untreated cells; n.d., not detectable; ACC, acetyl-CoA carboxylase; FAS, fatty acid synthase. B, percentage change of the relative intensity of 16:1-PI (16:0/16:1, 16:0/18:1–18:0/16:1, and 18:1/16:1) was determined by full scans in the negative ion mode. The fragmentation of 16:1-PI to 16:1 anions was analyzed by single reaction monitoring (SRM) and used to confirm the increase of 16:1-containing PI species. 100% corresponds to a relative intensity of 10.8 ± 0.8% (full scan) and to a MS signal intensity normalized to the total PI intensity of 0.45 ± 0.01 (SRM), respectively. C and D, relative intensities of major PI species from cells treated with or without bFGF (10 ng/ml) for 24 h were determined by full scans in the negative ion mode (C) or SRM (D). D, transitions to both fatty acid anions were analyzed for each PI species and the results averaged. E, cells were stimulated with bFGF (10 ng/ml) for 0–48 h, and percentage changes of the relative intensity of 16:1-PI and polyunsaturated PI (18:1/18:2, 38:2, 18:0/20:3, 16:0/20:4, 18:0/20:4-18:1/20:3, 18:1/20:4, 18:0/22:5) were determined. 100% corresponds to a relative intensity of 6.5 ± 0.3% and 64.6 ± 1.0% for 16:1-PI and polyunsaturated PI, respectively. F, percentage change of the relative intensities of 16:1-containing glycero-PLs (PC, PE, PS, PI, and PG), sphingomyelins (SM), and free 16:1 by stimulation with bFGF (10 ng/ml) for 24 h was determined. 100% corresponds to the relative intensity of untreated cells of 46.9 ± 1.9%, 33.3 ± 0.4%, 24.2 ± 1.8%, 10.8 ± 0.8% (see B), 45.7 ± 0.9%, 2.4 ± 0.2%, and 1.7 ± 0.1% for PC, PE, PS, PI, PG, SM, and free 16:1, respectively. G, percentage change of the relative intensities of PI species containing 16:1, 18:1 (16:0/18:1-18:0/16:1, 18:1/16:1 (16:0/18:2), 18:0/18:1, 18:1/18:1-18:0/18:2, 18:1/18:2, 18:1/20:4) or polyunsaturated fatty acids by stimulation with bFGF (10 ng/ml) for 24 h was determined. 100% corresponds to a relative intensity of 10.8 ± 0.8% (see B), 68.5 ± 0.2%, and 46.0 ± 0.1% for PI containing 16:1, 18:1, and polyunsaturated fatty acids, respectively. Data are given as means ± S.E. (error bars); n = 2–4. *, p < 0.05; **, p < 0.01; ***, p < 0.001 versus the untreated control (w/o); ANOVA + Tukey HSD post hoc tests (A, B, E, and F) and Student's t test (C and D).
FIGURE 4.
FIGURE 4.
The inducible 16:1-PI formation is specific for insulin and growth factors and not limited to Swiss 3T3 cells. A, cells were treated with the indicated stimuli at the concentrations described under “Experimental Procedures” for 24 h. The ratio of the relative intensities for 16:1- (16:0/16:1, 16:0/18:1-18:0/16:1, and 18:1/16:1) and sn-2–18:1-containing PI species (18:0/18:1, 18:1/18:1-18:0-18:2) is given. B, relative intensities of 16:1-PI from NIH-3T3 and 3T3-L1 cells are shown upon stimulation with 10 ng/ml bFGF for 24 h. Data are given as means ± S.E. (error bars); n = 3–6. *, p < 0.05; **, p < 0.01; ***; p < 0.001 versus the untreated control (w/o); ANOVA + Tukey HSD post hoc tests (A) and Student's t test (B).
FIGURE 5.
FIGURE 5.
The inducible 16:1-PI formation depends on de novo PI biosynthesis. A, LPIAT activities of microsomes from unstimulated Swiss 3T3 cells were determined for crude lyso-PI (50 μm) and a mixture of 16:0-, 16:1-, 18:1-, and 20:4-CoAs (12.5 μm, each). B–F, Swiss 3T3 cells were treated with or without bFGF (10 ng/ml), insulin (1 μm), or PDGF (25 ng/ml) for 24 h. B, microsomal LPIAT activities were measured for crude lyso-PI (50 μm) and a mixture of 16:0-, 18:1-, and 20:4-CoAs (16.7 μm, each). C, left, the incorporation of tritium-labeled inositol (2 μCi/ml) into the cellular lipid fraction was determined after 24 h. Decays per minute (dpm) were normalized to the amount of protein in the cell lysate. Right, relative intensities of 14d-16:1-containing PI species are given for cells incubated in presence of d14-16:1 (5 μm). D, mRNA expression of enzymes of PA biosynthesis and PI remodeling was determined by RT-PCR and is given as a percentage of untreated cells; n.d., not detectable; GPAT, glycerol-3-phosphate acyltransferase; LPAAT, lysophosphatidic acid acyltransferase. E and F, relative intensity of 16:1-containing PA (E) and DAG (F) is shown. Data are given as means ± S.E. (error bars); n = 3–4. *, p < 0.05; **, p < 0.01; ***, p < 0.01 versus the untreated control (w/o); ANOVA + Tukey HSD post hoc tests.
FIGURE 6.
FIGURE 6.
Formation and function of 16:1-PI in the signaling of the lipokine 16:1 in Swiss 3T3 cells. Glycerol 3-phosphate (G3P) is converted to PA during de novo biosynthesis of PLs. Dephosphorylation of PA yields DAG that is coupled to choline or ethanolamine for PC and PE biosynthesis. PS is formed from PC or PE by the exchange of the headgroup. Activation of PA as CDP-DAG initiates PG and PI biosynthesis. The lipokine 16:1 is endogenously formed in response to insulin and growth factors (GFs) or taken up from extracellular stores. 16:1 is subsequently incorporated into 16:1-PA, which is specifically converted to 16:1-PI through CDP-DAG synthase and PI synthase (de novo PI biosynthesis). The formation of 16:1-PI through LPIATs (remodeling PI biosynthesis) is negligible, instead. Levels of 16:1-PI correlate with cell proliferation. LPA, lyso-PA; LPI, lyso-PI; GPAT, glycerol-3-phosphate acyltransferase; ACC, acetyl-CoA carboxylase; FAS, fatty acid synthase; LPAAT, lysophosphatidic acid acyltransferase. Blue, preferred metabolic fate of 16:1. Dashed arrow, unfavored metabolic pathway.

Similar articles

Cited by

References

    1. Shindou H., Shimizu T. (2009) Acyl-CoA:lysophospholipid acyltransferases. J. Biol. Chem. 284, 1–5 - PubMed
    1. Kent C. (1995) Eukaryotic phospholipid biosynthesis. Annu. Rev. Biochem. 64, 315–343 - PubMed
    1. Burke J. E., Dennis E. A. (2009) Phospholipase A2 biochemistry. Cardiovasc. Drugs Ther. 23, 49–59 - PMC - PubMed
    1. Warensjö E., Ohrvall M., Vessby B. (2006) Fatty acid composition and estimated desaturase activities are associated with obesity and lifestyle variables in men and women. Nutr. Metab. Cardiovasc. Dis. 16, 128–136 - PubMed
    1. Paillard F., Catheline D., Duff F. L., Bouriel M., Deugnier Y., Pouchard M., Daubert J. C., Legrand P. (2008) Plasma palmitoleic acid, a product of stearoyl-CoA desaturase activity, is an independent marker of triglyceridemia and abdominal adiposity. Nutr. Metab. Cardiovasc. Dis. 18, 436–440 - PubMed

Publication types

MeSH terms

Substances