. 2012:4:137-44.
doi: 10.2147/CLEP.S31271. Epub 2012 May 15.

Causal diagrams and the logic of matched case-control studies

Affiliations

Causal diagrams and the logic of matched case-control studies

Eyal Shahar et al. Clin Epidemiol. 2012.

Erratum in

  • Clin Epidemiol. 2014;6:59

Abstract

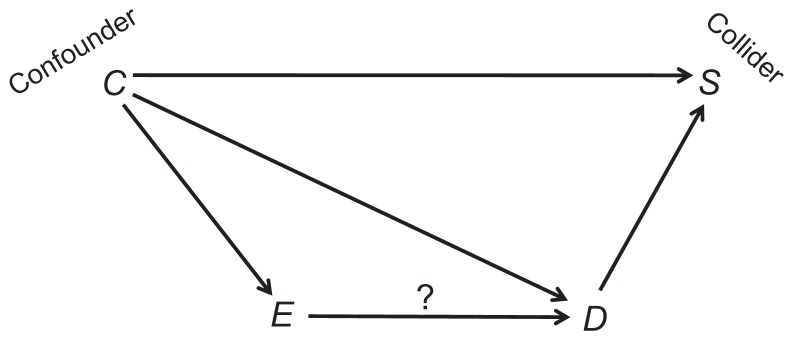
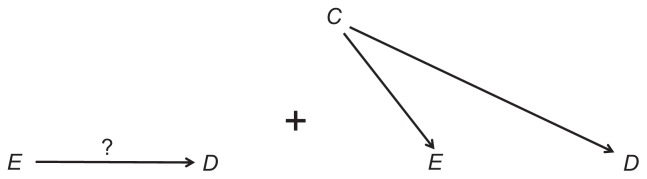
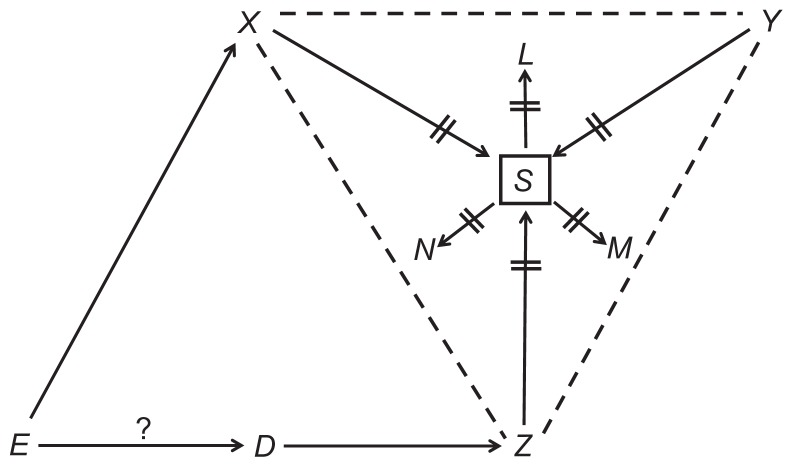
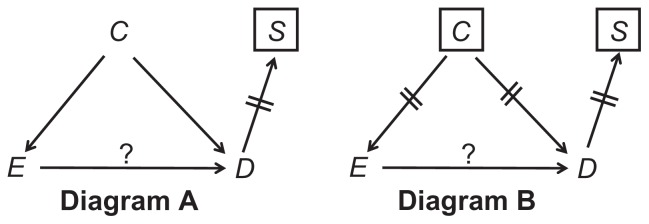
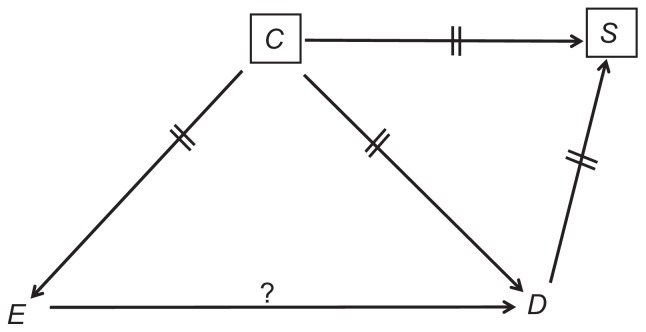
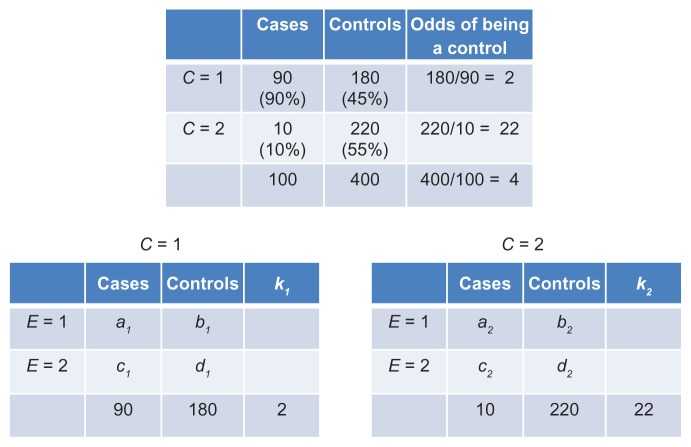
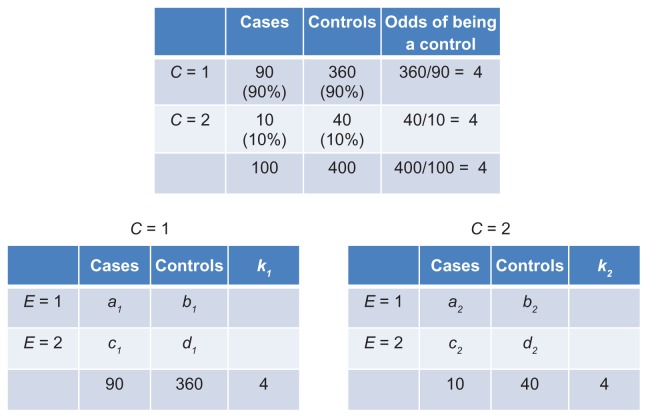
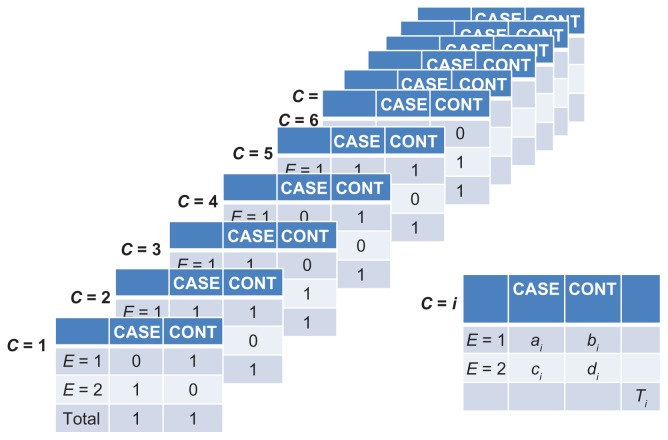
It is tempting to assume that confounding bias is eliminated by choosing controls that are identical to the cases on the matched confounder(s). We used causal diagrams to explain why such matching not only fails to remove confounding bias, but also adds colliding bias, and why both types of bias are removed by conditioning on the matched confounder(s). As in some publications, we trace the logic of matching to a possible tradeoff between effort and variance, not between effort and bias. Lastly, we explain why the analysis of a matched case-control study - regardless of the method of matching - is not conceptually different from that of an unmatched study.

Keywords: case-control study; causal diagrams; colliding bias; confounding bias; directed acyclic graphs; matching; variance.


Figures

Figure 1
Figure 1
A causal structure. Note: The question mark denotes the effect of interest.
Figure 2
Figure 2
Components of the marginal association between E and D. Note: The question mark denotes the effect of interest.
Figure 3
Figure 3
Consequences of conditioning on S. Note: The question mark denotes the effect of interest.
Figure 4
Figure 4
Confounding (A) and deconfounding (B) in an unmatched case-control study. Note: The question mark denotes the effect of interest.
Figure 5
Figure 5
The causal structure of a matched case-control study. Note: The question mark denotes the effect of interest.
Figure 6
Figure 6
Contributors to the null association between the confounder (C) and disease status (D) in a matched case-control study. Note: The question mark denotes the effect of interest.
Figure 7
Figure 7
Colliding bias superimposed on confounding bias in a matched case-control study. Note: The question mark denotes the effect of interest.
Figure 8
Figure 8
Special cases of matching: no net bias under the precise null (A); no colliding bias in the absence of confounding bias (B); colliding bias in the absence of confounding bias (C). Note: The question mark denotes the effect of interest.
Figure 9
Figure 9
Deconfounding in a matched case-control study. Note: The question mark denotes the effect of interest.
Figure 10
Figure 10
Association between an unmatched confounder (C) and disease status (top table); counts of cases and controls in C-specific associations of E and disease status (bottom tables).
Figure 11
Figure 11
Null association between a matched confounder (C) and disease status (top table); counts of cases and controls in C-specific associations of E and disease status (bottom tables).
Figure 12
Figure 12
Stratification on the confounder (C) when each matched pair shares a unique value of C.
Figure 13
Figure 13
Stratification on the confounder (C) when each matched pair shares a unique value of C, grouping into four possible results.

References

    1. Bland JM, Altman DG. Matching. Br Med J. 1994;309:1128. - PMC - PubMed
    1. Shahar E, Shahar DJ. Causal diagrams and three pairs of biases. In: Lunet N, editor. Epidemiology – Current Perspectives on Research and Practice. Rijeka: InTech; 2012. pp. 31–62.
    1. Kupper LL, Karon JM, Kleinbaum DG, Morgenstern H, Lewis DK. Matching in epidemiologic studies: validity and efficiency considerations. Biometrics. 1981;37:271–291. - PubMed
    1. Robinson LD, Jewell NP. Some surprising results about covariate adjustment in logistic regression models. Int Stat Rev. 1991;58:227–240.
    1. Breslow NE, Day NE. Statistical Methods in Cancer Research. II. Lyon, France: IARC Scientific Publications; 1987. - PubMed