Neural responses to advantageous and disadvantageous inequity
- PMID: 22701414
- PMCID: PMC3370647
- DOI: 10.3389/fnhum.2012.00165
Neural responses to advantageous and disadvantageous inequity
Abstract
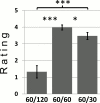
In this paper we study neural responses to inequitable distributions of rewards despite equal performance. We specifically focus on differences between advantageous inequity (AI) and disadvantageous inequity (DI). AI and DI were realized in a hyperscanning functional magnetic resonance imaging (fMRI) experiment with pairs of subjects simultaneously performing a task in adjacent scanners and observing both subjects' rewards. Results showed (1) hypoactivation of the ventral striatum (VS) under DI but not under AI; (2) inequity induced activation of the right dorsolateral prefrontal cortex (DLPFC) that was stronger under DI than under AI; (3) correlations between subjective evaluations of AI evaluation and bilateral ventrolateral prefrontal and left insular activity. Our study provides neurophysiological evidence for different cognitive processes that occur when exposed to DI and AI, respectively. One possible interpretation is that any form of inequity represents a norm violation, but that important differences between AI and DI emerge from an asymmetric involvement of status concerns.
Keywords: equity norm; functional magnetic resonance imaging (fMRI); social preferences; ventral striatum.
Figures


Similar articles
-
Neurophysiological analysis of disadvantageous social inequity: Exploring emotional behavior changes and c-Fos expression in a male rat model.Behav Brain Res. 2024 May 28;466:114983. doi: 10.1016/j.bbr.2024.114983. Epub 2024 Apr 3. Behav Brain Res. 2024. PMID: 38580200
-
Children's Inequity Aversion in Procedural Justice Context: A Comparison of Advantageous and Disadvantageous Inequity.Front Psychol. 2017 Oct 18;8:1855. doi: 10.3389/fpsyg.2017.01855. eCollection 2017. Front Psychol. 2017. PMID: 29093697 Free PMC article.
-
Neural correlates of advantageous and disadvantageous inequity in sharing decisions.PLoS One. 2014 Sep 19;9(9):e107996. doi: 10.1371/journal.pone.0107996. eCollection 2014. PLoS One. 2014. PMID: 25238541 Free PMC article.
-
The role of the anterior insula in social norm compliance and enforcement: Evidence from coordinate-based and functional connectivity meta-analyses.Neurosci Biobehav Rev. 2018 Sep;92:378-389. doi: 10.1016/j.neubiorev.2018.06.024. Epub 2018 Jun 26. Neurosci Biobehav Rev. 2018. PMID: 29958872 Review.
-
Stronger regulation of AI in biomedicine.Sci Transl Med. 2023 Sep 13;15(713):eadi0336. doi: 10.1126/scitranslmed.adi0336. Epub 2023 Sep 13. Sci Transl Med. 2023. PMID: 37703349 Free PMC article. Review.
Cited by
-
Inequality signals in dorsolateral prefrontal cortex inform social preference models.Soc Cogn Affect Neurosci. 2018 May 1;13(5):513-524. doi: 10.1093/scan/nsy020. Soc Cogn Affect Neurosci. 2018. PMID: 29635351 Free PMC article.
-
Brain mechanisms of social comparison and their influence on the reward system.Neuroreport. 2014 Nov 12;25(16):1255-65. doi: 10.1097/WNR.0000000000000255. Neuroreport. 2014. PMID: 25191923 Free PMC article. Review.
-
Corticostriatal Connectivity during Prosocial Decision-making Relates to Giving Behavior during Adolescence.J Cogn Neurosci. 2023 Sep 1;35(9):1432-1445. doi: 10.1162/jocn_a_02024. J Cogn Neurosci. 2023. PMID: 37382484 Free PMC article.
-
Social value orientation modulates fairness processing during social decision-making: evidence from behavior and brain potentials.Soc Cogn Affect Neurosci. 2021 Jul 6;16(7):670-682. doi: 10.1093/scan/nsab032. Soc Cogn Affect Neurosci. 2021. PMID: 33769539 Free PMC article.
-
Common and distinct equity preferences in children and adults.Front Psychol. 2024 Feb 14;15:1330024. doi: 10.3389/fpsyg.2024.1330024. eCollection 2024. Front Psychol. 2024. PMID: 38420165 Free PMC article.
References
-
- Akitsuki Y., Sugiura M., Watanabe J., Yamashita K., Sassa Y., Awata S., Matsuoka H., Maeda Y., Matsue Y., Fukuda H., Kawashima R. (2003). Context-dependent cortical activation in response to financial reward and penalty: an event-related fMRI study. Neuroimage 19, 1674–1685 10.1016/S1053-8119(03)00250-7 - DOI - PubMed
-
- Brosnan S. F. (2009). “Responses to inequity in non-human primates,” in Neuroeconomics. Decision Making and the Brain, eds Glimcher P. W., Camerer C., Fehr E., Poldrack R. A. (London, San Diego, Burlington: Elsevier; ), 285–302
LinkOut - more resources
Full Text Sources

