

doi: 10.1155/2011/253989.
Epub 2011 Sep 12.
An Optically Controlled 3D Cell Culturing System
Affiliations
- PMID: 22701475
- PMCID: PMC3373019
- DOI: 10.1155/2011/253989
Item in Clipboard
An Optically Controlled 3D Cell Culturing System
Adv Optoelectron.
.
Abstract
A novel 3D cell culture system was developed and tested. The cell culture device consists of a microfluidic chamber on an optically absorbing substrate. Cells are suspended in a thermoresponsive hydrogel solution, and optical patterns are utilized to heat the solution, producing localized hydrogel formation around cells of interest. The hydrogel traps only the desired cells in place while also serving as a biocompatible scaffold for supporting the cultivation of cells in 3D. This is demonstrated with the trapping of MDCK II and HeLa cells. The light intensity from the optically induced hydrogel formation does not significantly affect cell viability.
Figures
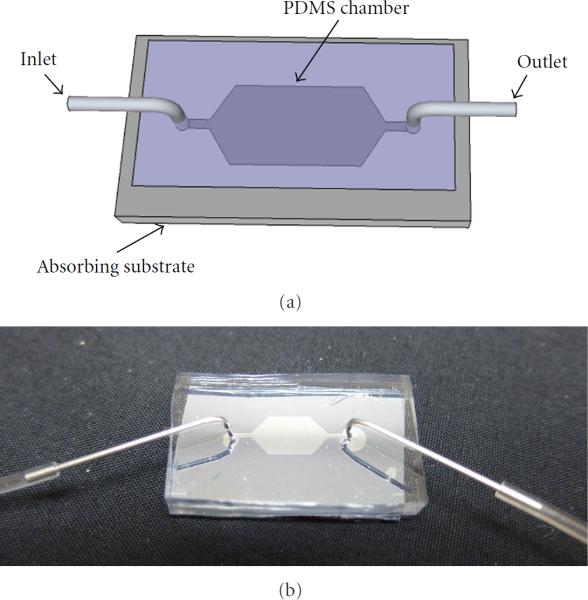
(a) Schematic representation of the 3D cell culture device. A microfluidic chamber is imprinted on polydimethylsiloxane (PDMS) using soft lithography and reversibly bonded to an optically absorbent substrate. Tubing is connected at the inlet and outlet ports. Fluid is introduced at the inlet and is drawn through the device by applying negative pressure at the outlet. (b) A prototype device is shown with fluidic tubing connected at the ports. In this design, the hexagonal chamber is approximately 9 mm × 5 mm; the PDMS piece and accompanying substrate are approximately 30 mm × 15 mm.
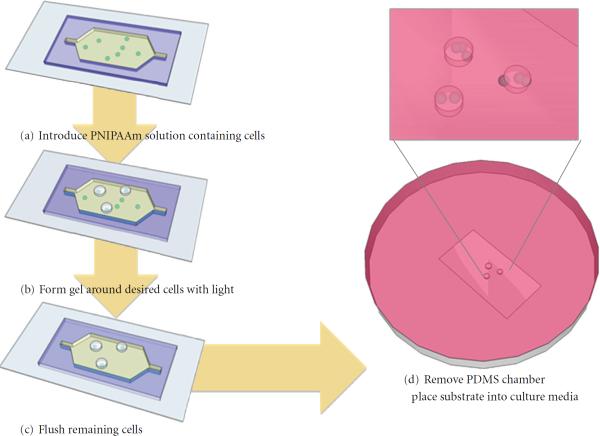
Optically controlled 3D culturing process. (a) The cell sample in hydrogel solution is introduced to the device chamber. (b) Desired cells are trapped in PNIPAAm hydrogel (cylindrical volume) using localized optical heating. (c) Undesired cells that remain in solution are flushed from the device. (d) While maintaining the hydrogel above the LCST, the PDMS chamber is removed, and the device substrate with the patterned 3D hydrogel is placed into culture media to allow cell growth.
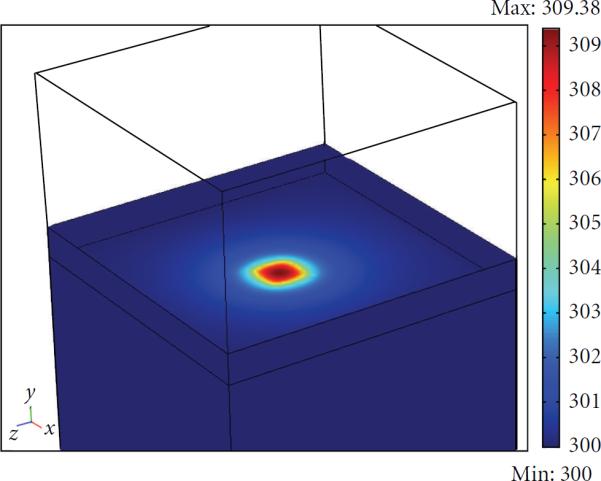
Simulated temperature (degrees Kelvin) in the culture device. In this model, two glass layers sandwich a 100-μm thick layer of water. The heat flux is situated at the bottom of the water layer in a 100 μm × 100 μm square area.
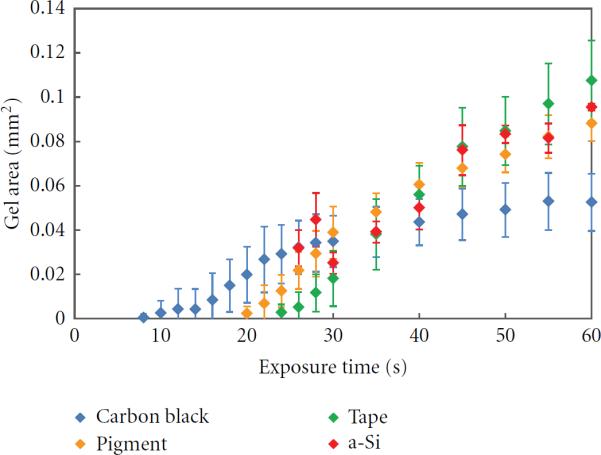
Hydrogel area versus time for various optically absorbent substrates. The optically smallest pattern that effectively produced gel was determined for each substrate, using the computer projector light source. The graph shows the average hydrogel area measured across five trials and the standard deviation for each. A two-minute delay between subsequent trials allowed sufficient time for the device to return to room temperature.
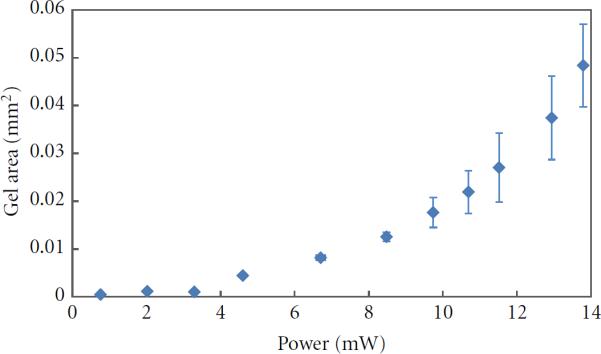
Hydrogel area as a function of power, using a 635-nm diode laser as the optical source. The area of the laser spot was approximately 108 μm2. The substrate was irradiated for a period of 30 seconds to generate each data point. The graph shows the average hydrogel area measured across five trials and the standard deviation of the measurements.
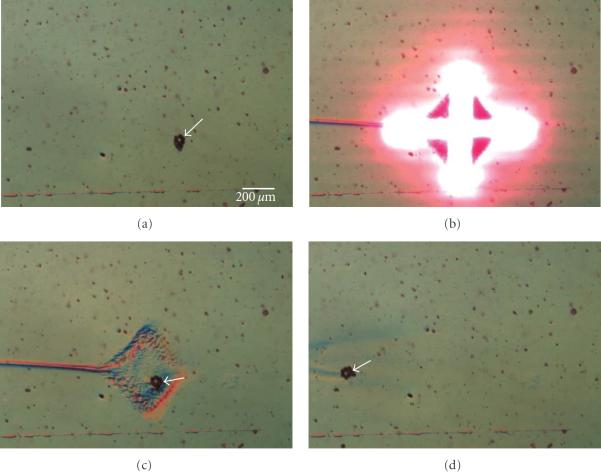
Trapping of 20-μm-diameter polystyrene microbeads in an optically patterned hydrogel. The scale bar is 200 μm. (a) A PNIPAAm solution containing 10- and 20-μm-diameter microbeads was introduced into the microfluidic chamber. The solution is flowing from the right to the left at a linear flow rate of 100 μm/s. A clump of beads was targeted for trapping, as indicated by the arrow. (b) An optical pattern is used to heat the substrate, causing a hydrogel to form in the illuminated area. (c) The hydrogel with the optical pattern removed, showing the trapped target particles. (d) Substrate cooling in the absence of optical heating reverses the trap, and the beads begin to flow away.
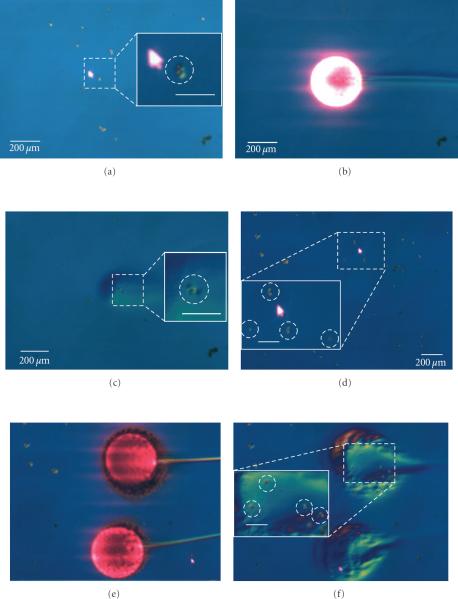
Gelation of hydrogels using optical control, demonstrating the trapping of MDCK II cells in 3D hydrogels. (a) Initial cell distribution. The two target cells are circled in the inset. Other cells will be flushed away. The inset scale bar is 100 μm. (b) A light pattern (bright circle) is used to trigger hydrogel formation (dark circular area), trapping the target cells. Cells not trapped in the gel are flushed away. (c) The two target cells remain in the 3D hydrogel. (d) Initial cell distribution when using parallel optical patterns to trap MDCK II cells in 3D hydrogels. Four target cells are circled in the inset. Other cells will be flushed away, except those trapped by the second optical pattern. The inset scale bar is 100 μm. (e) Light patterns (bright circles) are used to trigger hydrogel formation (dark circular areas), trapping the target cells while free cells are flushed away. (f) The four target cells remain in the 3D hydrogel.
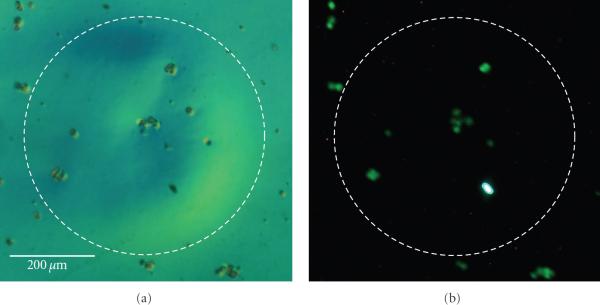
Cell viability testing using LIVE/DEAD assay on trapped MDCK II cells. (a) Initial distribution of MDCK II cells after 50 minutes in an optically patterned hydrogel. The starting cell density was approximately 1 × 10⁵ cells/mL in solution. The dashed circle encloses the area that was gelled. The circular objects that are visible are the cells. (b) Fluorescent image of the same cells from (a), demonstrating approximately 100% viability. Cells lying outside the gel were not taken into account. Live cells fluoresce green, while dead cells fluoresce red. Fluorescent cells appear as bright spots in these images.
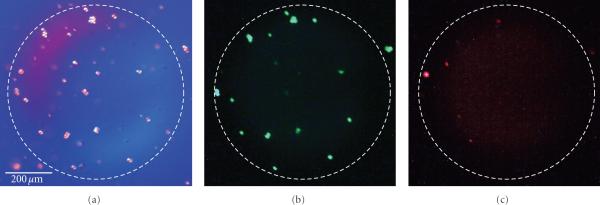
Cell viability testing using LIVE/DEAD assay on trapped HeLa cells. (a) Initial distribution of HeLa cells after 45 minutes in an optically patterned hydrogel. The starting cell density was approximately 1 × 10⁶ cells/mL in solution. (b–c) Fluorescent images of the same cells from (a), demonstrating approximately 81% viability. Live cells fluoresce green (b), while dead cells fluoresce red (c). Fluorescent cells appear as bright spots in these images.
Similar articles
-
Microfluidic Platform for the Long-Term On-Chip Cultivation of Mammalian Cells for Lab-On-A-Chip Applications.Sensors (Basel). 2017 Jul 10;17(7):1603. doi: 10.3390/s17071603. Sensors (Basel). 2017. PMID: 28698531 Free PMC article.
-
Controllable 3D alginate hydrogel patterning via visible-light induced electrodeposition.Biofabrication. 2016 Apr 25;8(2):025004. doi: 10.1088/1758-5090/8/2/025004. Biofabrication. 2016. PMID: 27108617
-
Label-Free On-Chip Selective Extraction of Cell-Aggregate-Laden Microcapsules from Oil into Aqueous Solution with Optical Sensor and Dielectrophoresis.ACS Sens. 2018 Feb 23;3(2):410-417. doi: 10.1021/acssensors.7b00834. Epub 2018 Jan 24. ACS Sens. 2018. PMID: 29299919 Free PMC article.
-
[Use of Porous Hydrogel as a 3D Scaffold for the Growth of Leukemic B Lymphocytes].Klin Onkol. 2017 Spring;30(Supplementum1):184-186. Klin Onkol. 2017. PMID: 28471202 Czech.
-
Fabrication of High-Aspect-Ratio 3D Hydrogel Microstructures Using Optically Induced Electrokinetics.Micromachines (Basel). 2016 Apr 12;7(4):65. doi: 10.3390/mi7040065. Micromachines (Basel). 2016. PMID: 30407438 Free PMC article.
References
-
- Dove A. Cell-based therapies go live. Nature Biotechnology. 2002;20(4):339–343. - PubMed
-
- Wilan KH, Scott CT, Herrera S. Chasing a cellular fountain of youth. Nature Biotechnology. 2005;23(7):807–815. - PubMed
-
- Segers VFM, Lee RT. Stem-cell therapy for cardiac disease. Nature. 2008;451(7181):937–942. - PubMed
-
- Xu W, Liu L, Charles IG. Microencapsulated iNOS-expressing cells cause tumor suppression in mice. The FASEB Journal. 2002;16(2):213–215. - PubMed
Grants and funding
LinkOut - more resources
Full Text Sources