

doi: 10.1371/journal.pone.0037598.
Epub 2012 May 31.
Exploiting ligand-protein conjugates to monitor ligand-receptor interactions
Affiliations
- PMID: 22701522
- PMCID: PMC3365113
- DOI: 10.1371/journal.pone.0037598
Item in Clipboard
Exploiting ligand-protein conjugates to monitor ligand-receptor interactions
PLoS One.
2012.
Abstract
We introduce three assays for analyzing ligand-receptor interactions based on the specific conjugation of ligands to SNAP-tag fusion proteins. Conjugation of ligands to different SNAP-tag fusions permits the validation of suspected interactions in cell extracts and fixed cells as well as the establishment of high-throughput assays. The different assays allow the analysis of strong and weak interactions. Conversion of ligands into SNAP-tag substrates thus provides access to a powerful toolbox for the analysis of their interactions with proteins.
Conflict of interest statement
Figures
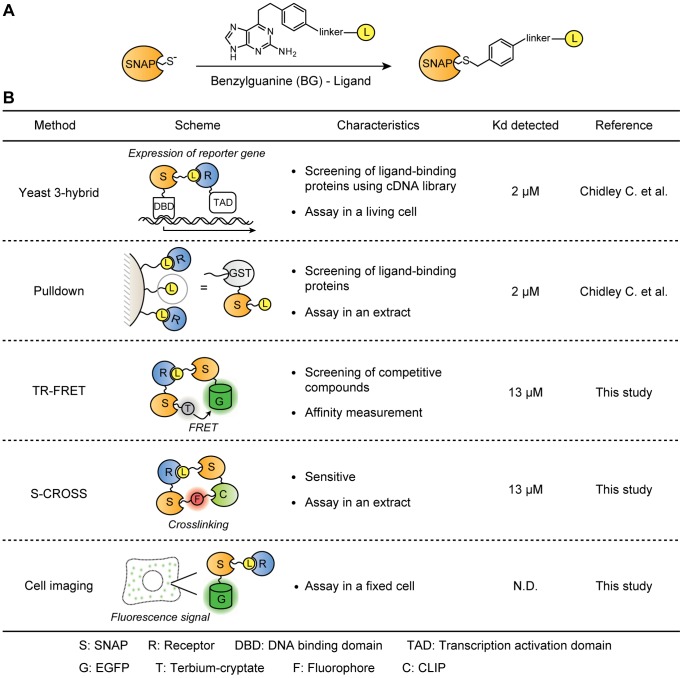
(A) Covalent labeling of SNAP-tag with a ligand using a BG derivative. (B) Schematic representation of the different SNAP-based methods. The highest Kd values detected in this study using the pairs of MTX-eDHFR (WT and mutants) are presented for each method.
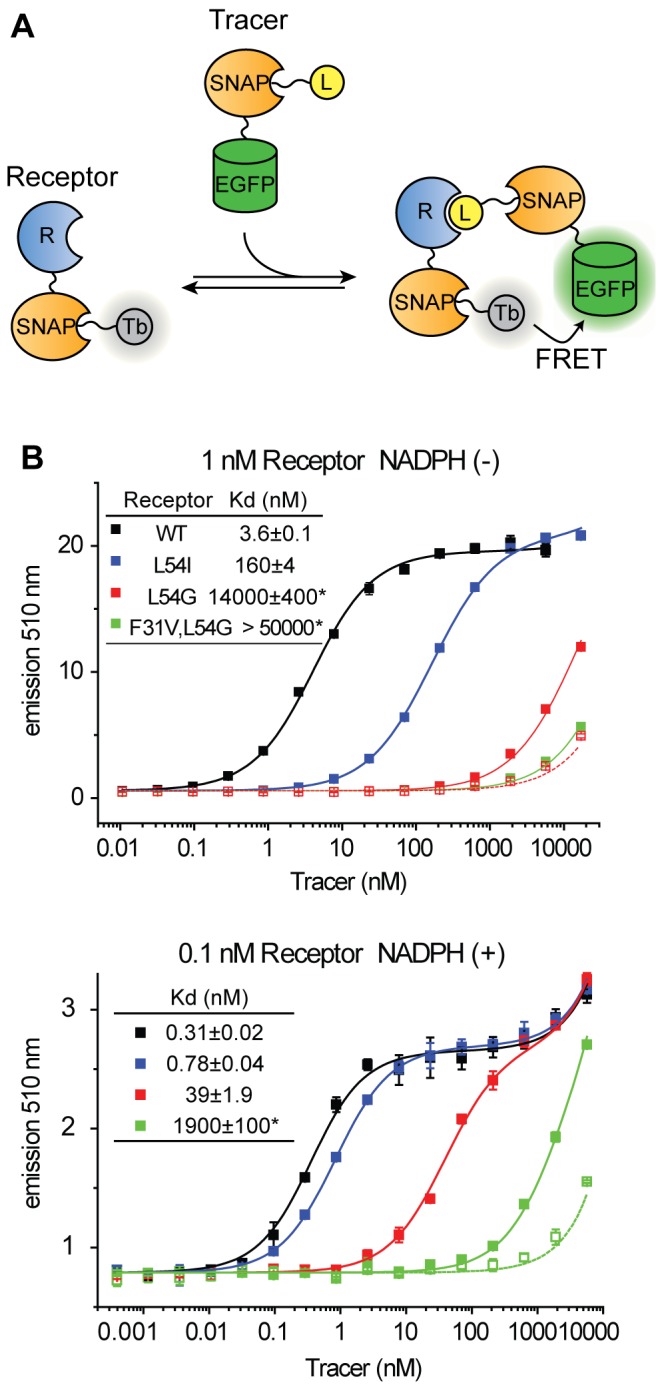
(A) Scheme of the titration binding assays. The titration assay measures the affinity of the tracer for the receptor. (B) Titration assay using MTX-SNAP-EGFP (filled rectangle) or SNAP-EGFP (empty rectangle) as tracer and SNAP-eDHFR as receptor in the absence and presence of 100 µM NADPH. SNAP-eDHFR is 50% labeled with BG-Terbium cryptate (Tb). Representative data using receptor concentration of 1 nM (in the absence of NADPH) and 0.1 nM (in the presence of NADPH) are shown. The specific receptor concentration was chosen so that it was below the Kd of the analyzed interaction. Kd values and the standard error of the mean are shown in the graph. * indicates that the Kd values were calculated with Fmax of the higher affinity samples (see Materials and Methods).
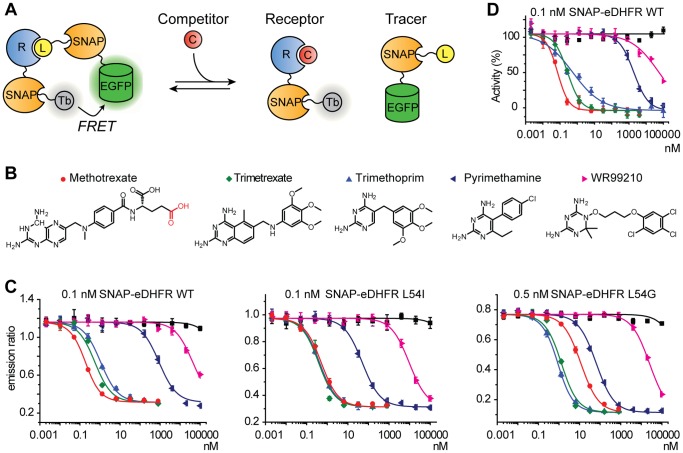
(A) Scheme of the competition binding assay. The competition assay measures the affinity of the ligand for the receptor. (B) Chemical structures of DHFR inhibitors. MTX was linked to BG via the carboxyl group highlighted in red. (C) SNAP-based TR-FRET competition assays using indicated concentrations of SNAP-eDHFR WT, L54I and L54G. Concentrations of MTX-SNAP-EGFP are 1 nM, 2 nM, and 30 nM for SNAP-eDHFR WT, L54I and L54G, respectively. Rectangle filled with black indicates dilution series of DMSO. Maximum DMSO concentration is 0.5% at 100 µM compounds. (D) DHFR enzymatic activity inhibition assay using SNAP-eDHFR WT.
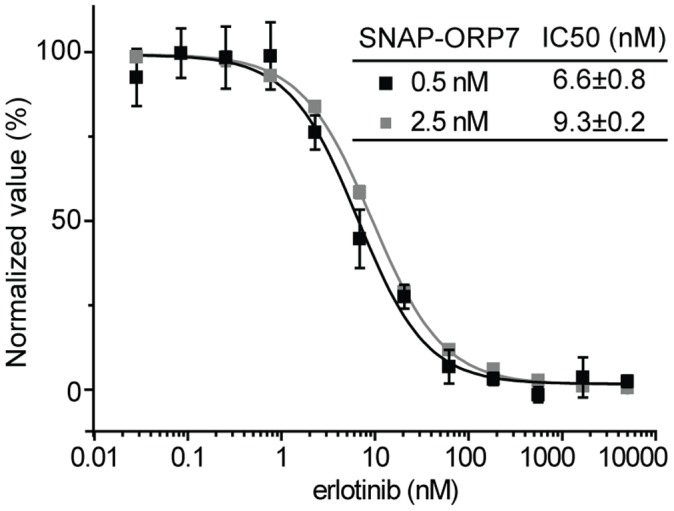
The assay was performed at indicated concentrations of SNAP-ORP7 (receptor) and erlotinib-SNAP-EGFP (tracer) with erlotinib as a competitor. IC50 values and the standard error of the mean are shown.
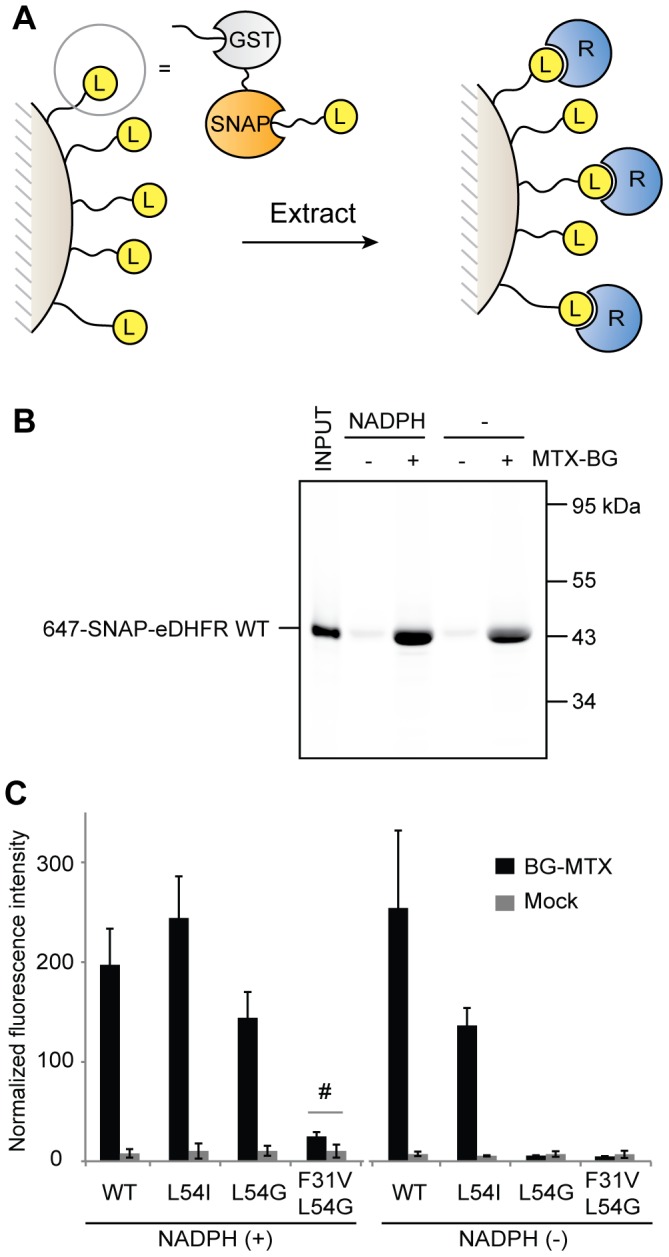
(A) Scheme of the pulldown assay. The BG-ligand is immobilized on glutathione sepharose beads via GST-SNAP. Bound receptor proteins are concentrated on the beads after incubation with the extract and washing. (B) SNAP-eDHFR WT labeled with BG-647 (1 µM) was subjected to pulldown assay in the absence or presence of 100 µM NADPH using MTX immobilized on beads (MTX-BG +) or mock beads (MTX-BG -). Bound proteins were eluted with glutathione, submitted to SDS-PAGE and detected by in-gel fluorescence scanning. (C) Fluorescence signal of bound proteins normalized with the input signal in each gel (Mean±SD, n = 3). # represents P = 0.03 in paired t-test.
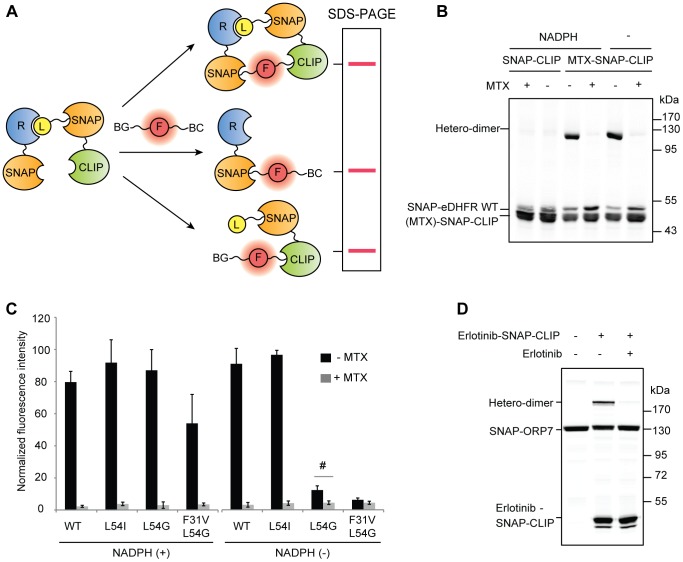
(A) Scheme of the S-CROSS assay. SNAP-receptor and ligand-SNAP-CLIP are incubated to form a complex. BG-fluorophore-BC preferentially crosslinks proteins that are in close spatial proximity. (B) SNAP-eDHFR WT (1 µM) was mixed with MTX-SNAP-CLIP or unlabeled SNAP-CLIP (1 µM) in the presence or absence of free MTX (50 µM). The experiments were performed in the absence or presence of 100 µM NADPH. Then, the mixture was treated with 2.5 µM BG-647-BC. Labeled proteins were resolved by SDS-PAGE and detected by in-gel fluorescence scanning. (C) Fluorescence signal of the hetero-crosslinking products in the presence or absence of free MTX (Mean±SD, n = 3–5). # represents P = 0.001 in paired t-test. (D) S-CROSS assay in cell extract. SNAP-ORP7 was expressed in HEK293 cells. After preparation of extract, SNAP-ORP7 was subjected to S-CROSS assay using erlotinib-SNAP-CLIP (2 µM) in the absence or presence of free erlotinib (10 µM).
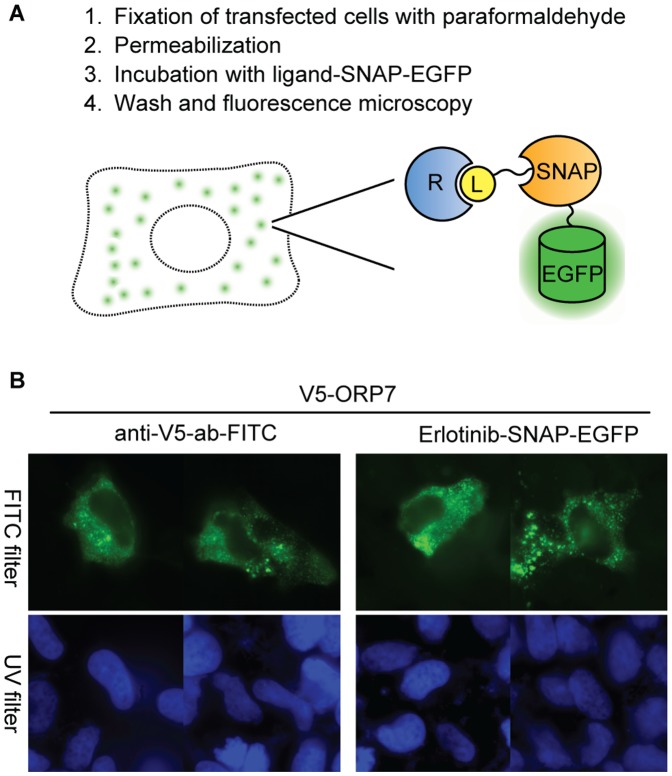
(A) Scheme of the cell imaging assay. The receptor protein is transiently expressed in mammalian cells. Cells are fixed with 4% paraformaldehyde, and then permeabilized with detergent. Ligand-SNAP-EGFP is incubated with the cells. Immediately after washing, samples are analyzed with a fluorescence microscope. (B) Fluorescence micrographs of U2OS cells transiently expressing V5-ORP7 probed with FITC-conjugated anti-V5 antibody (left) and erlotinib-SNAP-EGFP (right) by cell imaging assay (FITC filter in green). Nuclear staining with Hoechst 33342 is shown in blue (UV filter).
Similar articles
-
Site-specific, covalent labeling of recombinant antibody fragments via fusion to an engineered version of 6-O-alkylguanine DNA alkyltransferase.Bioconjug Chem. 2009 May 20;20(5):1010-5. doi: 10.1021/bc9000257. Bioconjug Chem. 2009. PMID: 19388673
-
Quenched substrates for live-cell labeling of SNAP-tagged fusion proteins with improved fluorescent background.Anal Chem. 2010 Oct 1;82(19):8186-93. doi: 10.1021/ac101521y. Anal Chem. 2010. PMID: 20815338
-
Binding characteristics of galectin-3 fusion proteins.Glycobiology. 2017 May 1;27(5):457-468. doi: 10.1093/glycob/cwx007. Glycobiology. 2017. PMID: 28104787
-
Using GFP--ligand fusions to measure receptor-mediated endocytosis in living cells.Vitam Horm. 2002;65:81-95. doi: 10.1016/s0083-6729(02)65060-5. Vitam Horm. 2002. PMID: 12481543 Review.
-
SNAP-tag technology: a powerful tool for site specific conjugation of therapeutic and imaging agents.Curr Pharm Des. 2013;19(30):5437-42. doi: 10.2174/1381612811319300014. Curr Pharm Des. 2013. PMID: 23431986 Review.
Cited by
-
Click chemistry for targeted protein ubiquitylation and ubiquitin chain formation.Nat Protoc. 2015 Oct;10(10):1594-611. doi: 10.1038/nprot.2015.106. Epub 2015 Sep 24. Nat Protoc. 2015. PMID: 26401915
-
Semisynthetic biosensors for mapping cellular concentrations of nicotinamide adenine dinucleotides.Elife. 2018 May 29;7:e32638. doi: 10.7554/eLife.32638. Elife. 2018. PMID: 29809136 Free PMC article.
-
Kinetic and Structural Characterization of the Self-Labeling Protein Tags HaloTag7, SNAP-tag, and CLIP-tag.Biochemistry. 2021 Aug 24;60(33):2560-2575. doi: 10.1021/acs.biochem.1c00258. Epub 2021 Aug 2. Biochemistry. 2021. PMID: 34339177 Free PMC article.
-
Red and far-red cleavable fluorescent dyes for self-labelling enzyme protein tagging and interrogation of GPCR co-internalization.RSC Chem Biol. 2024 Nov 18;6(1):11-20. doi: 10.1039/d4cb00209a. eCollection 2025 Jan 2. RSC Chem Biol. 2024. PMID: 39610654 Free PMC article.
-
A Simplified Guide RNA Synthesis Protocol for SNAP- and Halo-Tag-Based RNA Editing Tools.Molecules. 2025 Feb 26;30(5):1049. doi: 10.3390/molecules30051049. Molecules. 2025. PMID: 40076283 Free PMC article.
References
-
- Rix U, Superti-Furga G. Target profiling of small molecules by chemical proteomics. Nat Chem Biol. 2009;5:616–624. - PubMed
-
- de Jong LAA, Uges DRA, Franke JP, Bischoff R. Receptor–ligand binding assays: Technologies and Applications. Journal of Chromatography B. 2005;829:1–25. - PubMed
-
- Inglese J, Johnson RL, Simeonov A, Xia M, Zheng W, et al. High-throughput screening assays for the identification of chemical probes. Nat Chem Biol. 2007;3:466–479. - PubMed
-
- Holdgate GA, Anderson M, Edfeldt F, Geschwindner S. Affinity-based, biophysical methods to detect and analyze ligand binding to recombinant proteins: Matching high information content with high throughput. Journal of Structural Biology. 2010;172:142–157. - PubMed
-
- Zhu Z, Cuozzo J. Review Article: High-Throughput Affinity-Based Technologies for Small-Molecule Drug Discovery. Journal of Biomolecular Screening. 2009;14:1157–1164. - PubMed
Publication types
MeSH terms
Substances
LinkOut - more resources
Full Text Sources
Other Literature Sources
Molecular Biology Databases
Research Materials
