. 2012;7(5):e37631.
doi: 10.1371/journal.pone.0037631. Epub 2012 May 31.

Ultrahigh-field MRI in human ischemic stroke--a 7 tesla study

Affiliations

Ultrahigh-field MRI in human ischemic stroke--a 7 tesla study

Vince I Madai et al. PLoS One. 2012.

Abstract

Introduction: Magnetic resonance imaging (MRI) using field strengths up to 3 Tesla (T) has proven to be a powerful tool for stroke diagnosis. Recently, ultrahigh-field (UHF) MRI at 7 T has shown relevant diagnostic benefits in imaging of neurological diseases, but its value for stroke imaging has not been investigated yet. We present the first evaluation of a clinically feasible stroke imaging protocol at 7 T. For comparison an established stroke imaging protocol was applied at 3 T.

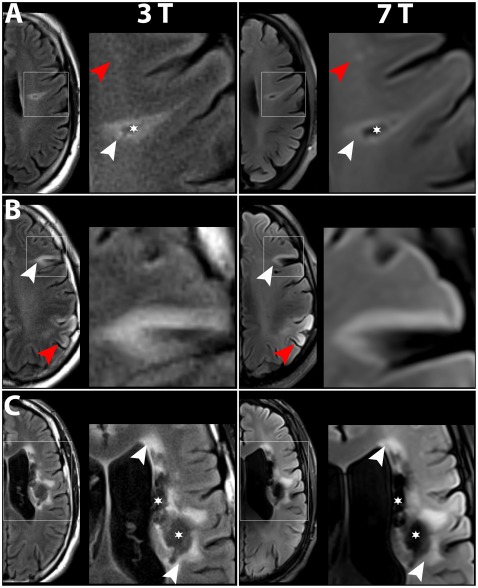
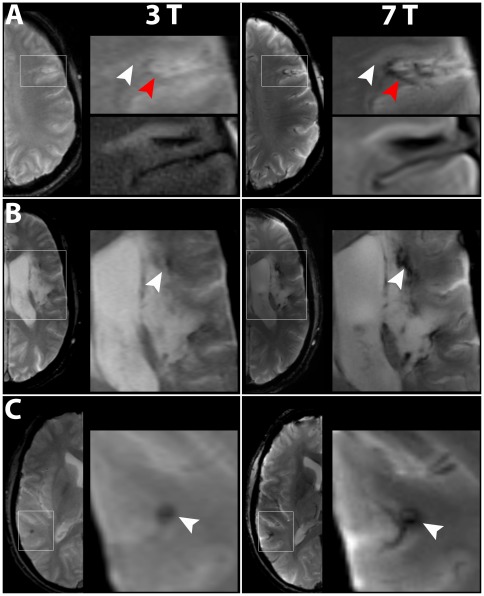
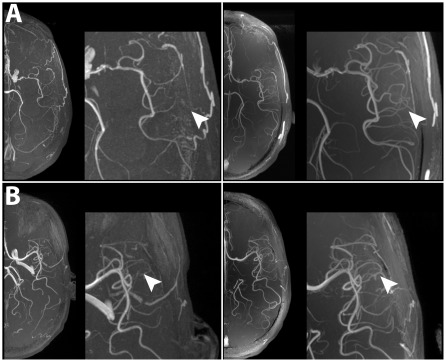
Methods: In a prospective imaging study seven patients with subacute and chronic stroke were included. Imaging at 3 T was immediately followed by 7 T imaging. Both protocols included T1-weighted 3D Magnetization-Prepared Rapid-Acquired Gradient-Echo (3D-MPRAGE), T2-weighted 2D Fluid Attenuated Inversion Recovery (2D-FLAIR), T2-weighted 2D Fluid Attenuated Inversion Recovery (2D-T2-TSE), T2* weighted 2D Fast Low Angle Shot Gradient Echo (2D-HemoFLASH) and 3D Time-of-Flight angiography (3D-TOF).

Results: The diagnostic information relevant for clinical stroke imaging obtained at 3 T was equally available at 7 T. Higher spatial resolution at 7 T revealed more anatomical details precisely depicting ischemic lesions and periinfarct alterations. A clear benefit in anatomical resolution was also demonstrated for vessel imaging at 7 T. RF power deposition constraints induced scan time prolongation and reduced brain coverage for 2D-FLAIR, 2D-T2-TSE and 3D-TOF at 7 T versus 3 T.

Conclusions: The potential of 7 T MRI for human stroke imaging is shown. Our pilot study encourages a further evaluation of the diagnostic benefit of stroke imaging at 7 T in a larger study.


Conflict of interest statement

Competing Interests: The authors have declared that no competing interests exist.

Figures

Figure 1
Figure 1. Comparison of T2-FLAIR images obtained at 3 T and 7 T.
In all patients, all lesions detected at 3 T were also visible at 7 T. Boxed areas are shown at higher magnification. A) Patient No. 3, with a small chronic lesion consisting of hyperintense postischemic tissue (white arrowheads) surrounding a tissue defect area (asterisk); compare also figure 2 A. At 7 T, the intensity values of the tissue defect area were comparable to CSF, while at 3 T, the intensity values were comparable to white matter. Contrast between postischemic and healthy brain tissue was higher at 3 T. However, small white matter lesions (red arrowheads) were easier to identify at 7 T. B) Patient No. 1, with a chronic stroke lesion (white arrowheads) and a subacute lesion (red arrowheads). Both lesion types were readily identifiable at both field strengths. As in A), contrast between the lesion and healthy tissue appeared to be higher at 3 T. C) Patient No. 4, with a large chronic infarct, consisting of hyperintense lesion areas (white arrowheads) and hypointense defect areas (asterisks). Again, CSF-filled tissue defect areas were easier to identify at 7 T, while the lesion to healthy tissue contrast was higher at 3 T. Compare also fig. 2 A–C.
Figure 2
Figure 2. Comparison of T1-weighted images derived from T1-MPRAGE at 3 T and 7 T.
In all patients, MPRAGE at 7 T depicted the internal structure of stroke lesion in higher detail compared with 3 T. Boxed areas are shown at higher magnification. A) Patient No. 3. The tissue defect area appeared larger and less well confined at 3 T in contrast to 7 T (white arrowheads). Virchow-Robin spaces were seen in more detail and higher frequency at 7 T (red arrowheads). B) In patient No. 1, the chronic stroke lesion (white arrowheads) presented as an hypointense area – indicating gliosis – and as a disruption of the cortical band. These characteristics of the lesion were depicted in higher detail level and contrast at 7 T. The subacute lesion (red arrowheads) showed a different internal structure of the cortical band compared with healthy cortex. Within the lesion, the cortical band was divided into a superficial hyperintense layer and a deeper hypointense layer (asterisks). Differentiation of the two layers was much easier at 7 T. C) Patient No. 4. In this large infarct, differentiation of hypointense gliosis (white arrowheads) and healthy tissue was again clearer at 7 T. Inhomogeneities between the frontal and occipital cortex and paramedian deep structures – typical for 7 T – were more pronounced in this patient compared to A) and B).
Figure 3
Figure 3. Comparison of T2-weighted imaging performed at 3 T and 7 T.
Boxed areas are shown at higher magnification. A) In patient No. 3, artifacts were present (red arrowheads). Contrast and detail level of the lesion (white arrowhead) and of Virchow-Robin spaces were not higher at 7 T. B) In contrast, in patient No. 1 no artifacts were present. Virchow Robin spaces (white arrowheads) were depicted in higher detail at 7 T and the delineation of the lesion (red arrowheads) from healthy tissue was higher at 7 T. C) Same patient as in B). Also in the region of the deep nuclei T2-weighted imaging at 7 T showed better delineation, e.g. between deep nuclei (red asterisks) and fibre bundles of the internal capsule (white asterisks).
Figure 4
Figure 4. Comparison of T2*-weighted images acquired with HemoFLASH at 3 T and 7 T.
In all patients, HemoFLASH provided higher anatomic detail level at 7 T. Moreover, hypointense perilesional hemosiderin deposits were much more pronounced at 7 T. Boxed areas are shown at higher magnification. A) In patient No 3, anatomical detail level and contrast of the lesion (white arrowheads) to healthy tissue were higher at 7 T imaging. T2-FLAIR weighted high magnification images are shown for comparison below. A perilesional hypointense area, indicating hemosiderin deposits, was much more pronounced at 7 T (red arrowheads). B) In patient No. 4, again both anatomical details as well as the imaging of hemosiderin (white arrowheads) were superior at 7 T. C) Incidental finding of a cavernous angioma (white arrowhead) in patient No. 5. The internal structure of the lesion, showing a nodular characteristic with a hypointense rim, and the depiction of feeding vessels were more pronounced at 7 T, facilitating the diagnosis.
Figure 5
Figure 5. Comparison of MR-angiographies derived from 3D TOF acquisitions at 3 T and 7 T.
In all patients, TOF at 7 T was able to depict the branches of the main cerebral arteries in higher anatomical detail. In patients No. 4 (A) and No. 7 (B), the left MCA territory is shown in higher magnification. In comparison with 3 T, clearly more first and second order branches were visible at 7 T in comparison with 3 T (white arrowheads).

References

    1. Merino JG, Warach S. Imaging of acute stroke. Nat Rev Neurol. 2010;6:560–571. doi: 10.1038/nrneurol.2010.129. - DOI - PubMed
    1. Lupo JM, Li Y, Hess CP, Nelson SJ. Advances in ultra-high field MRI for the clinical management of patients with brain tumors. Current Opinion in Neurology. 2011;24:605–615. doi: 10.1097/WCO.0b013e32834cd495. - DOI - PubMed
    1. Dammann P, Barth M, Zhu Y, Maderwald S, Schlamann M, et al. Susceptibility weighted magnetic resonance imaging of cerebral cavernous malformations: prospects, drawbacks, and first experience at ultra–high field strength (7-Tesla) magnetic resonance imaging. Neurosurgical FOCUS. 2010;29:E5. doi: 10.3171/2010.6.FOCUS10130. - DOI - PubMed
    1. Kwon D, Kim J, Oh S, Jeong H, Park S, et al. Seven-tesla magnetic resonance images of the substantia nigra in Parkinson disease. Annals of Neurology, Annals of Neurology 71, 71: 267, 267–277, 277. doi:10.1002/ 2012;ana.22592 10.1002/ana.22592. - PubMed
    1. Tallantyre EC, Dixon JE, Donaldson I, Owens T, Morgan PS, et al. Ultra-high-field imaging distinguishes MS lesions from asymptomatic white matter lesions. Neurology. 2011;76:534–539. doi: 10.1212/WNL.0b013e31820b7630. - DOI - PMC - PubMed

Publication types