. 2012;7(6):e37441.
doi: 10.1371/journal.pone.0037441. Epub 2012 Jun 12.

A highly scalable peptide-based assay system for proteomics

Affiliations

A highly scalable peptide-based assay system for proteomics

Igor A Kozlov et al. PLoS One. 2012.

Abstract

We report a scalable and cost-effective technology for generating and screening high-complexity customizable peptide sets. The peptides are made as peptide-cDNA fusions by in vitro transcription/translation from pools of DNA templates generated by microarray-based synthesis. This approach enables large custom sets of peptides to be designed in silico, manufactured cost-effectively in parallel, and assayed efficiently in a multiplexed fashion. The utility of our peptide-cDNA fusion pools was demonstrated in two activity-based assays designed to discover protease and kinase substrates. In the protease assay, cleaved peptide substrates were separated from uncleaved and identified by digital sequencing of their cognate cDNAs. We screened the 3,011 amino acid HCV proteome for susceptibility to cleavage by the HCV NS3/4A protease and identified all 3 known trans cleavage sites with high specificity. In the kinase assay, peptide substrates phosphorylated by tyrosine kinases were captured and identified by sequencing of their cDNAs. We screened a pool of 3,243 peptides against Abl kinase and showed that phosphorylation events detected were specific and consistent with the known substrate preferences of Abl kinase. Our approach is scalable and adaptable to other protein-based assays.


Conflict of interest statement

Competing Interests: The authors have read the journal’s policy and have the following conflicts: Stock ownership of Prognosys Biosciences Inc. All authors have stock ownership of Prognosys Biosciences Inc. and were employed at this company when the presented research was performed. Currently, Sarah Munchel is employed by Illumina Inc. and Patricia Villegas is employed by Maven Biotechnologies. This does not alter the authors’ adherence to all the PLoS ONE policies on sharing data and materials.

Figures

Figure 1
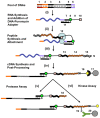
Figure 1. Process for protease and kinase peptide substrate generation and screening.
i) DNA templates containing a T7 promoter (1), ribosomal binding site (2) –, sequences coding for N- and C-terminal peptide tags (3, 5), a variable region (4) coding for custom peptide sequences, and an adapter ligation region (6) are transcribed and a DNA adapter is attached to the 3’-end of all RNAs via template-directed ligation . The adapter consists of DNAs (7) and (11) cross-linked via a psoralen residue (8), a linker (9), and a 3’-puromycin residue (10). ii–iii) During in vitro translation, a stalled ribosome (12) allows the puromycin residue to enter the ribosome A-site and attach to the C-terminus of the peptide, creating an peptide-RNA fusion . Each peptide in the fusion pool has a custom peptide region (14) and two tags (13) and (15). The C-terminal tag can be used to purify correctly translated full-length peptides. iv) The N-terminal peptide sequence is cleaved with TEV protease to expose N-terminal cysteine which is then biotinylated (16). The RNA is converted to cDNA by reverse transcription followed by RNAse H treatment , and the resulting peptide-cDNA fusions are immobilized on streptavidin coated magnetic beads (17). v) Protease Assay. In a subsequent assay procedure, the immobilized pool is treated with a protease of interest. The cDNAs attached to cleaved peptides (18) are released, collected, amplified, and sequenced. vi) Kinase Assay. The pool of peptide-cDNA fusions is released from streptavidin coated magnetic beads (17) and treated with a solution containing tyrosine kinase. Phosphorylated peptides (19) are immobilized on anti-phosphorotyrosine antibody coated magnetic beads (20), specifically eluted with phenyl phosphate, collected, amplified, and sequenced.
Figure 2
Figure 2. Individual steps of the peptide substrate generation and screening process.
A) Peptides were attached to RNA as shown in Fig. 1, steps (ii–iii) and reaction products analyzed by denaturing polyacrylamide gel electrophoresis (PAGE, Novex 15% TBE-Urea gels stained with SYBR Gold, Life Technologies). PAGE Lane 1: starting RNA with puromycin adapter; Lane 2: product of peptide attachment. B) Peptides were biotinylated at their N-terminus as shown in Fig. 1, step (iv). PAGE Lane 1: starting nucleic acid-peptide fusion; Lane 2: product of cleavage with TEV protease; Lane 3: product of reaction of biotin-PEG attachment to the N-terminal cysteine. C) Presence of fully translated peptide (3–4–5) was confirmed by detection of the C-terminal FLAG tag (5) by mouse anti-FLAG antibodies (Sigma) (1) and Cy3 labeled goat anti-mouse antibodies (Jackson ImmunoResearch) (2). Peptide-RNA fusions were captured by hybridization of a common region (6) to oligonucleotides (7) attached to beads (8). Beads were imaged using a DM6000B automated fluorescence microscope and imaging system (Leica). Bar 1 represents in vitro translation in the presence of puromycin modified template; Bar 2 is a no template control; Bar 3 is puromycin modified template without in vitro translation. D) Protease assay results. The process is shown in Fig. 1, step (v). Individual peptide-RNA fusions containing peptide substrates for enterokinase (EK) and thrombin (TRB) proteases (AGDDDDKAG and GLVPRGSAG respectively) were cleaved by individual proteases and the reaction products were analyzed by PAGE. Lanes 1–3 show results for peptide substrate for enterokinase (EK), lanes 4–6 show results for peptide substrate for thrombin (TRB). E) Quantitative RT-PCR analysis of the assays shown in panel D, lanes 2–3 and 5–6. The Y-axis represents relative DNA quantities calculated from qPCR Ct values.
Figure 3
Figure 3. HCV NS3/4A protease cleavage map of the 3,011 amino acid sequence of HCV polyprotein.
Cleavage sites were identified by assaying 3,001 overlapping 10-mer peptides covering the entire 3,011 amino acid sequence of HCV polyprotein. The graphs represent a response to HCV NS3/4A protease treatment for three experiments (see Methods). The X-axis shows coordinates along the HCV polyprotein. The Y–axis represents log-transformed p-values with sign showing directionality. Z-scores were transformed using -sign(z)x10xLog10(Pz) where Pz is p-value of derived from standard normal distribution. Red dotted lines mark cutoffs computed from the maximum transformed Z-score in the negative direction. Published HCV NS3/4A protease cleavage sites (1711, 1972, and 2420) are numbered in black. A new site (2172) is labeled in blue. The numbers in the labels represent the position of the P1 amino acid (amino acid position at the C-terminus of the cleaved peptide bond) in the HCV polyprotein. Assay signals that did not reach significance in all three experimental conditions (15, 30, and 60 minutes protease treatments from the top to the bottom panels respectively), but were detected in at least two experimental conditions are labeled in red. The numbers in these labels represent the amino acid position in the HCV polyprotein corresponding to the maximum of the peaks.
Figure 4
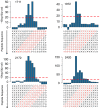
Figure 4. Results from peptides spanning the cleavage sites 1711, 1972, 2172, and 2420.
The plots show data from sets of overlapping 10-mer peptides representing portions of the HCV polyprotein where protease activity was detected at all three time points in our assay (Fig. 3). Red dotted lines mark cutoffs computed from the maximum transformed Z-score in the negative direction. The Y–axis represents log-transformed p-values with the sign showing directionality. Z-scores were transformed using -sign(z)x10xLog10(Pz) where Pz is the p-value derived from standard normal distribution. Because the peptide sequences are shifted in increments of 1 amino acid, several adjacent peptides contain sufficient recognition sequences to be cleaved. Peptide sequences are written vertically and the HCV NS3/4A protease recognition sequences corresponding to identified P4-P4’ positions are shown in red.
Figure 5
Figure 5. Abl kinase phosphorylation map of a 3,243-plex peptide substrate pool.
Each bar along the X-axis corresponds to a signal from an individual peptide in the pool. In order to simplify visualization, peptides were split into three groups. Group A contains 1,690 peptides that do not have any tyrosine residues and includes 19 negative control peptides that are derived from a known Abl kinase peptide substrate (GEAIYAAPFA) where the tyrosine residue was changed to all remaining 19 natural amino acids while the rest of the sequence was kept constant. Group B contains 1,355 peptides that have at least one tyrosine residue. Group C contains 198 peptides that are known to be substrates for Abl kinase or derived from a known Abl kinase peptide substrate (GEAIYAAPFA) where amino acid residues in each individual position (except the tyrosine residue) were systematically changed to all remaining 19 natural amino acids while the rest of the sequence was kept constant. The Y–axis represents log-transformed p-values with sign showing directionality. Red dotted lines mark cutoffs corresponding to the maximum Z-score observed for peptides lacking tyrosine. Z-scores were transformed using -sign(z)x10xLog10(Pz) where Pz is the p-value derived from standard normal distribution.
Figure 6
Figure 6. Sensitivity of Abl kinase to sequence variation as a function of position.
Each panel shows the effect of varying the amino acid sequence at one position in the Abl kinase substrate GEAIYAAPFA. The position that is varied (top left of each panel) is shown relative to the central tyrosine, which is in the ‘0’ position. The amino acid that is substituted at the position of interest is shown on the X-axis, with the reference sequence shown in red. The Y–axis represents log-transformed p-values with sign showing directionality. The data are a subset of the 3,243-plex pool data shown in Fig. 5 (Group C).

Similar articles

Cited by

References

    1. Wetterstrand KA. DNA Sequencing Costs: Data from the NHGRI Large-Scale Genome Sequencing Program. National Human Genome Research Institute website. 2011;24 Available: www.genome.gov/sequencingcosts Accessed 2012 April.
    1. Finlay WJ, Bloom L, Cunningham O. Phage display: a powerful technology for the generation of high specificity affinity reagents from alternative immune sources. Methods Mol Biol. 2011;681:87–101. - PMC - PubMed
    1. Whitney M, Crisp JL, Olson ES, Aguilera TA, Gross LA, et al. Parallel in vivo and in vitro selection using phage display identifies protease-dependent tumor-targeting peptides. J Biol Chem. 2010;285:22532–22541. - PMC - PubMed
    1. Brown KC. Peptidic tumor targeting agents: the road from phage display peptide selections to clinical applications. Curr Pharm Des. 2010;16:1040–1054. - PMC - PubMed
    1. Scholle MD, Kriplani U, Pabon A, Sishtla K, Glucksman MJ, et al. Mapping protease substrates by using a biotinylated phage substrate library. Chembiochem. 2006;7:834–838. - PubMed

Publication types

MeSH terms